分布式链路跟踪介绍 (一)
使用 spring Boot Actuator监控微服务实例,使用 Hystrix监控Hystrix Command等,对于一个大型的微服务架构系统,会有哪些常见问题?
1.如何串联调用链,快速定位问题
没有使用调用链的方式,而是一个log的方式,分主机一台一台的查,真是麻烦死,需要各自的微服务团队自我保护,写的代码加入log,防止背锅。
2.如何厘清微服务之间的依赖关系
一个下单可能经历10几个微服务,他们直接得调用流程是什么样子的。
3.如何进行各个服务接口的性能分折
目前是通过log来的,调用前时间,调用后的时间。
4.如何跟踪业务流的处理顺序
这个顺序就需要通过通过开发人员在一起进行梳理。
Sleuth介绍及应用(二)
spring Cloud Sleuth为 spring Cloud提供了分布式跟踪的解决方案,它大量借用了Google Dapper、 Twitter Zipkin和 Apache HTrace的设计一下 Sleuth的术语, Sleuth借用了 Dapper的术语。
- ① span(跨度)
基本工作单元。 span用一个64位的id唯一标识。除ID外,span还包含其他数据,例如描述、时间戳事件、键值对的注解(标签), spanID、span父 ID等。 span被启动和停止时,记录了时间信息。初始化 span被为"rootspan",该 span的 id和 trace的 ID相等。
- ② trace(跟踪)
一组共享"rootspan"的 span组成的树状结构称为 traceo trace也用一个64位的 ID唯一标识, trace中的所有 span都共享该 trace的 ID
- ③ Oannotation(标注)
annotation用来记录事件的存在,其中,核心annotation用来定义请求的开始和结束。
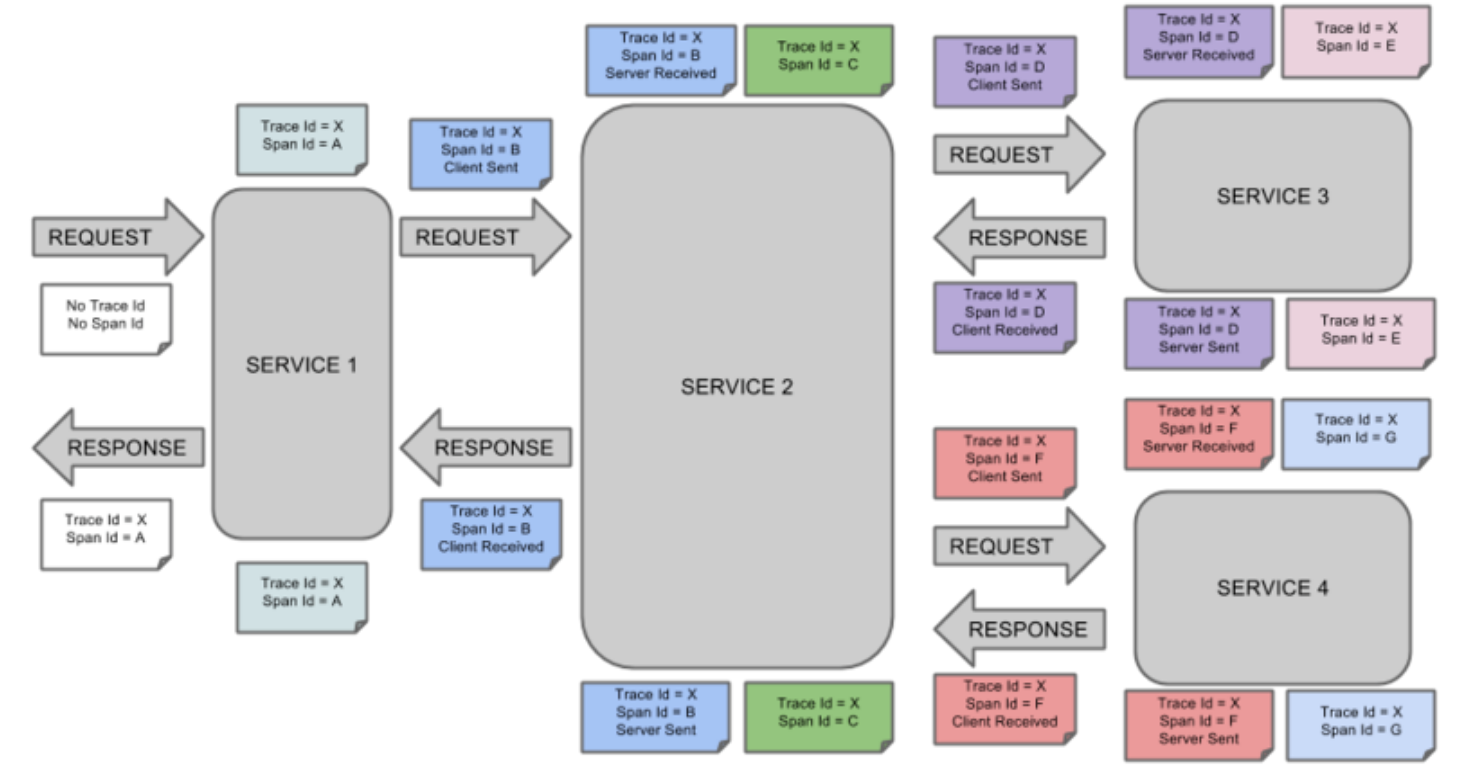
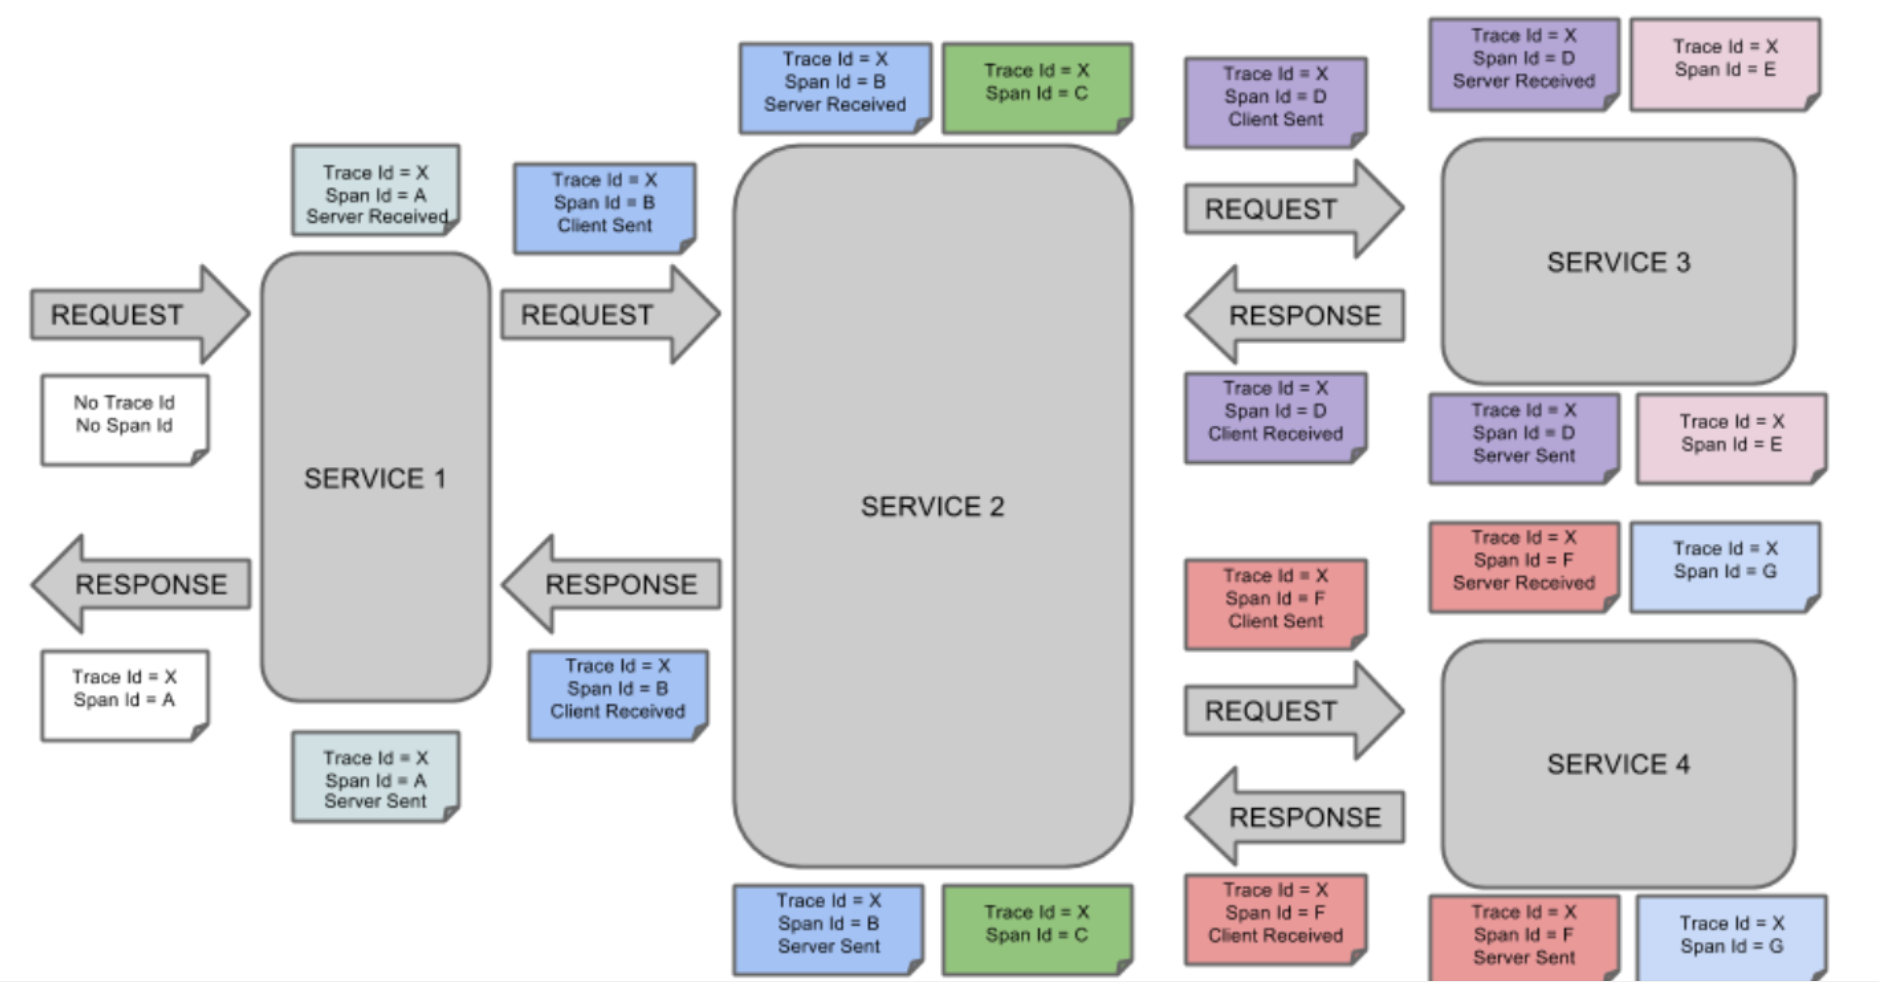
- CS( Client sent客户端发送):客户端发起一个请求,该 annotation描述了span的开始。
- SR( server Received服务器端接收):服务器端获得请求并准备处理它。如果用 SR减去 CS时间戳,就能得到网络延迟。
- SS( server sent服务器端发送):该 annotation表明完成请求处理(当响应发回客户端时)。如果用 SS减去 SR时间戳,就能得到服务器端处理请求所需的时间。
- CR( Client Received客户端接收): span结束的标识。客户端成功接收到服务器端的响应。如果 CR减去 CS时间戳,就能得到从客户端发送请求到服务器响应的所需的时间。
请求依次经过Service1–Service2–Service3–Service4时,span、trace、annotation的变化。
Sleuth整合Zipkin实现分布式链路跟踪(三)
- ① 源码
11-ms-simple-provider-user-trace 和 11-ms-simple-consumer-order-trace

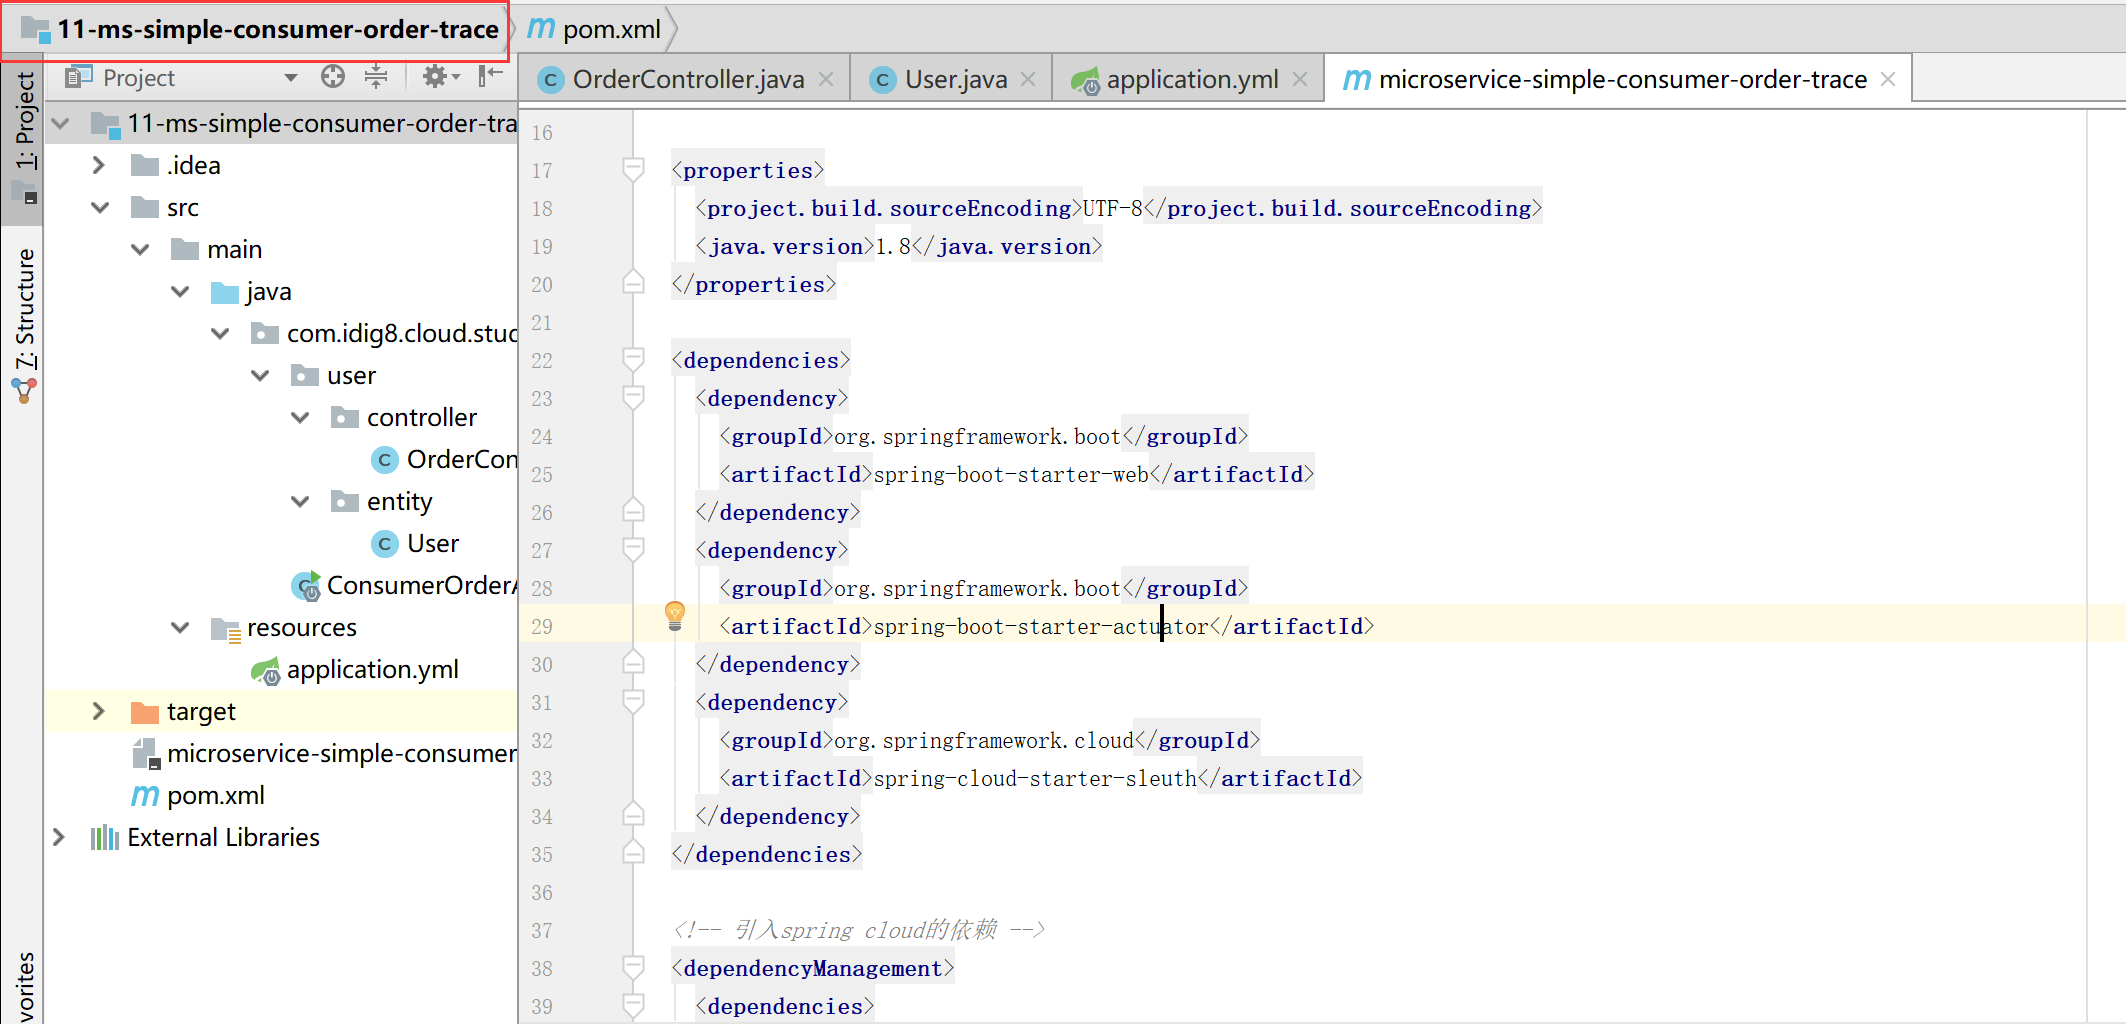
- ② 添加依赖
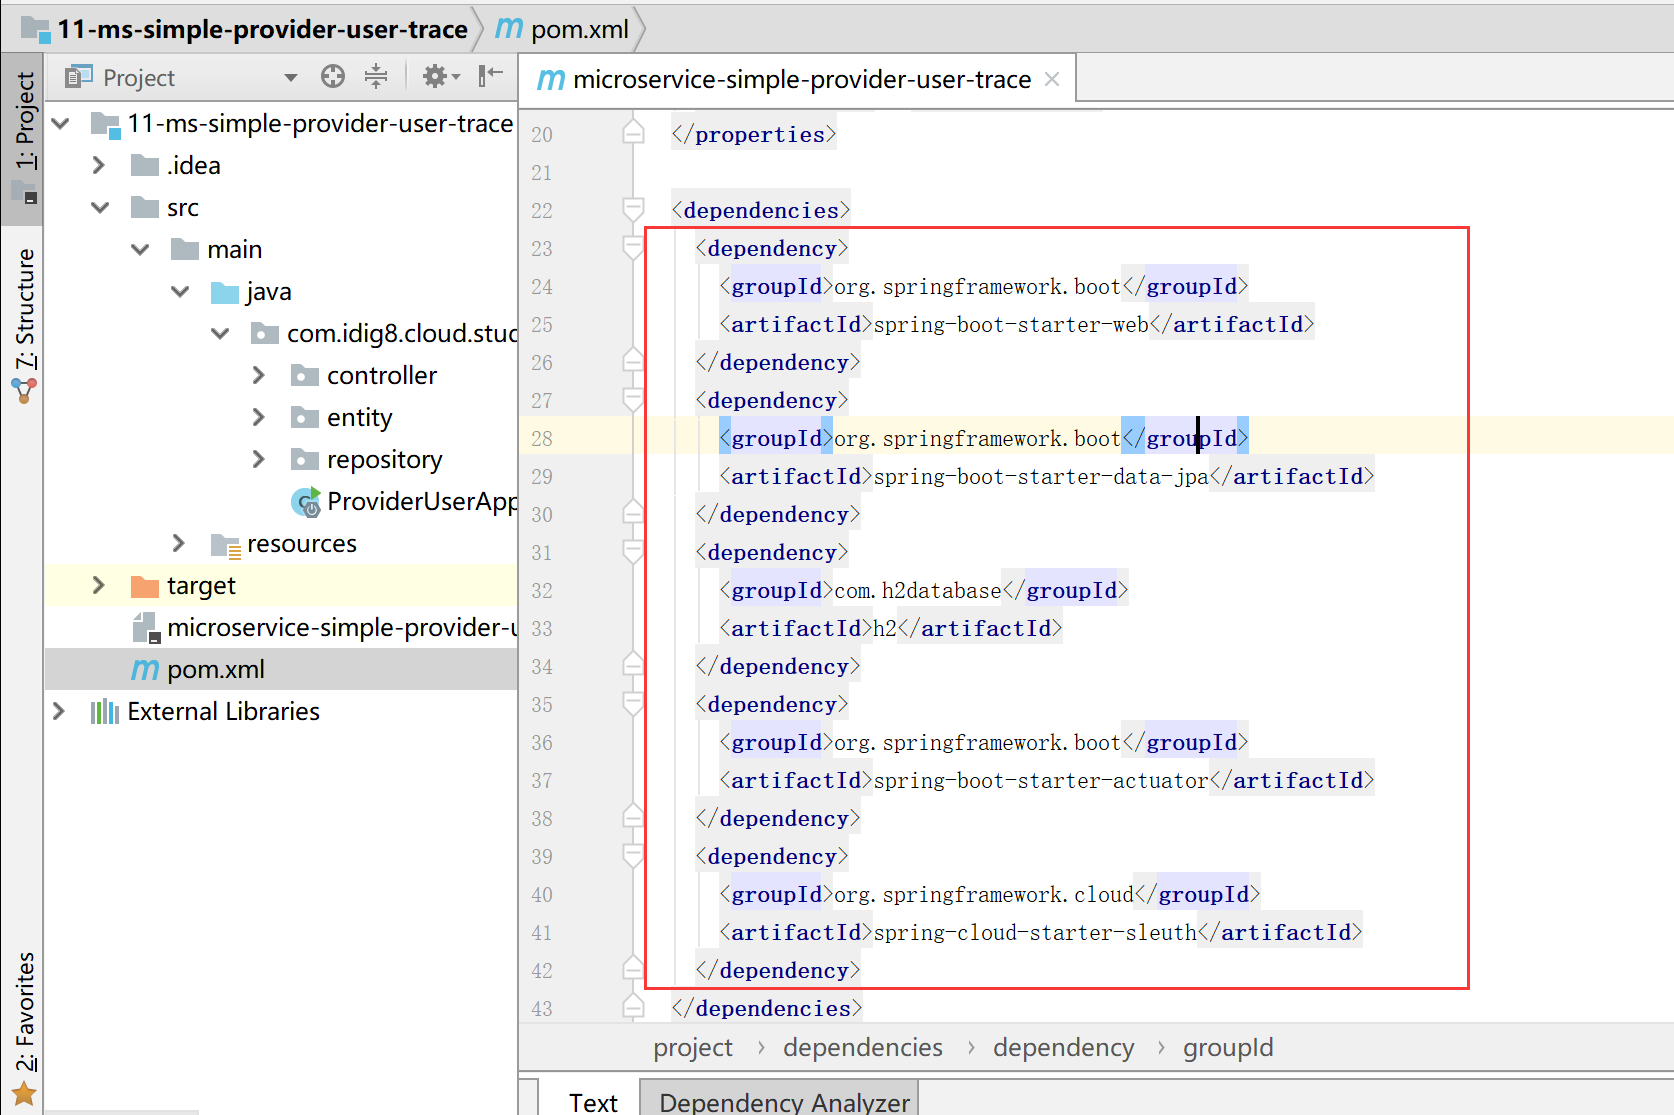
11-ms-simple-provider-user-trace
 <dependency>
      <groupId>org.springframework.boot</groupId>
      <artifactId>spring-boot-starter-web</artifactId>
    </dependency>
    <dependency>
      <groupId>org.springframework.boot</groupId>
      <artifactId>spring-boot-starter-data-jpa</artifactId>
    </dependency>
    <dependency>
      <groupId>com.h2database</groupId>
      <artifactId>h2</artifactId>
    </dependency>
    <dependency>
      <groupId>org.springframework.boot</groupId>
      <artifactId>spring-boot-starter-actuator</artifactId>
    </dependency>
    <dependency>
      <groupId>org.springframework.cloud</groupId>
      <artifactId>spring-cloud-starter-sleuth</artifactId>
    </dependency>
不用添加任何的注释,自动执行。
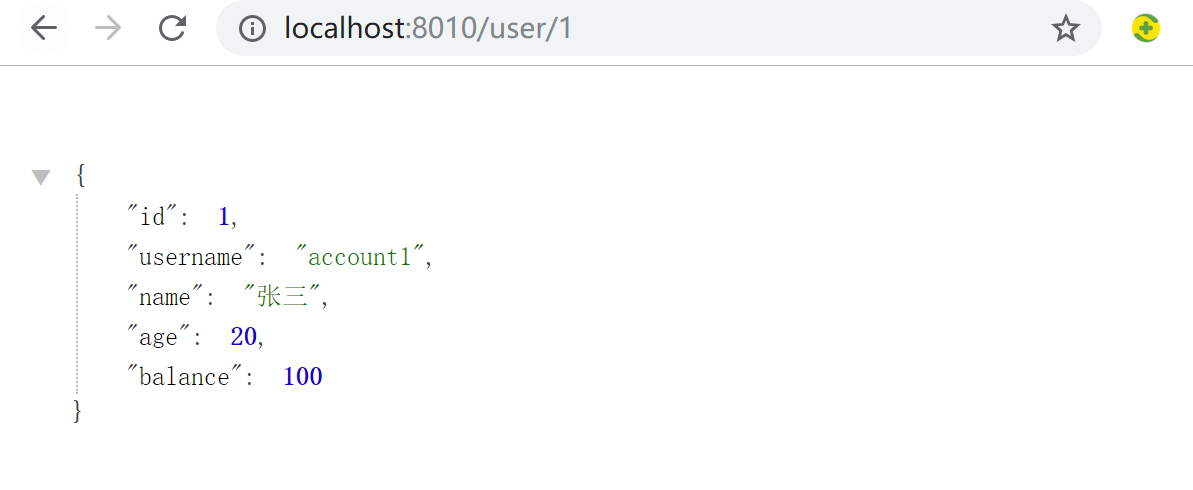
启动项目11-ms-simple-provider-user-trace 和 08-ms-provider-user,访问地址:http://localhost:8010/user/1,查看后台日志,发现有trace和span的日志打印。
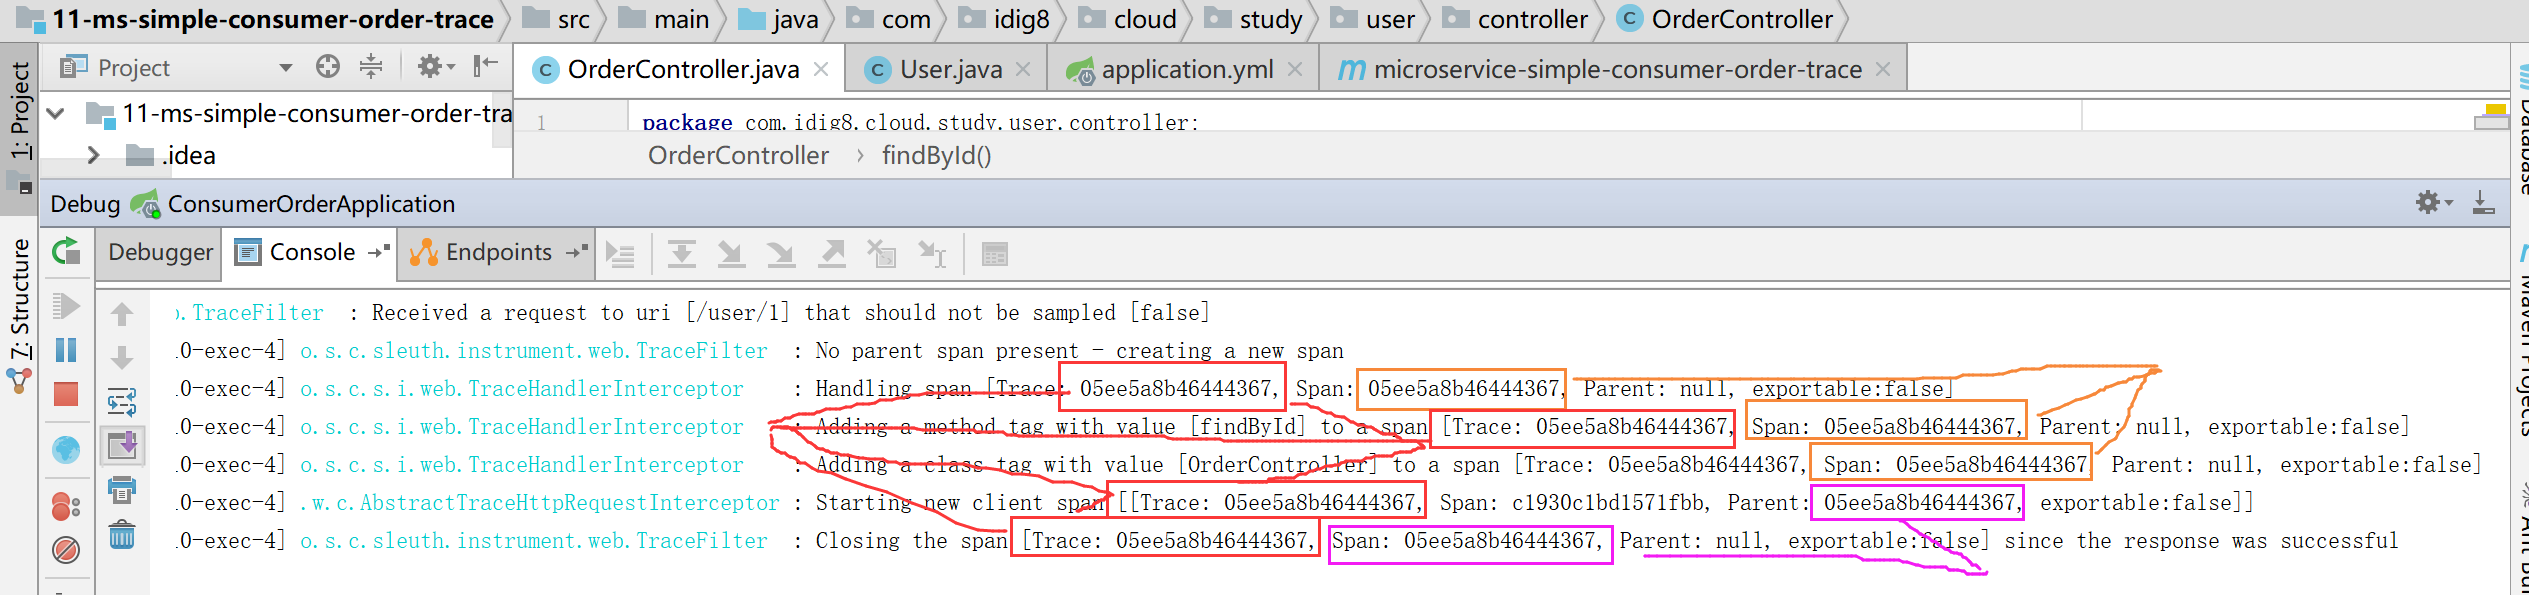
通过order微服务访问user微服务,Trace始终不变,span是块,相通的span说明是在一块的。
之前看日志一点一点的找是不是太2了,直接还是通过可视化的工具来完成了吧。下面一起说说Zipkin。
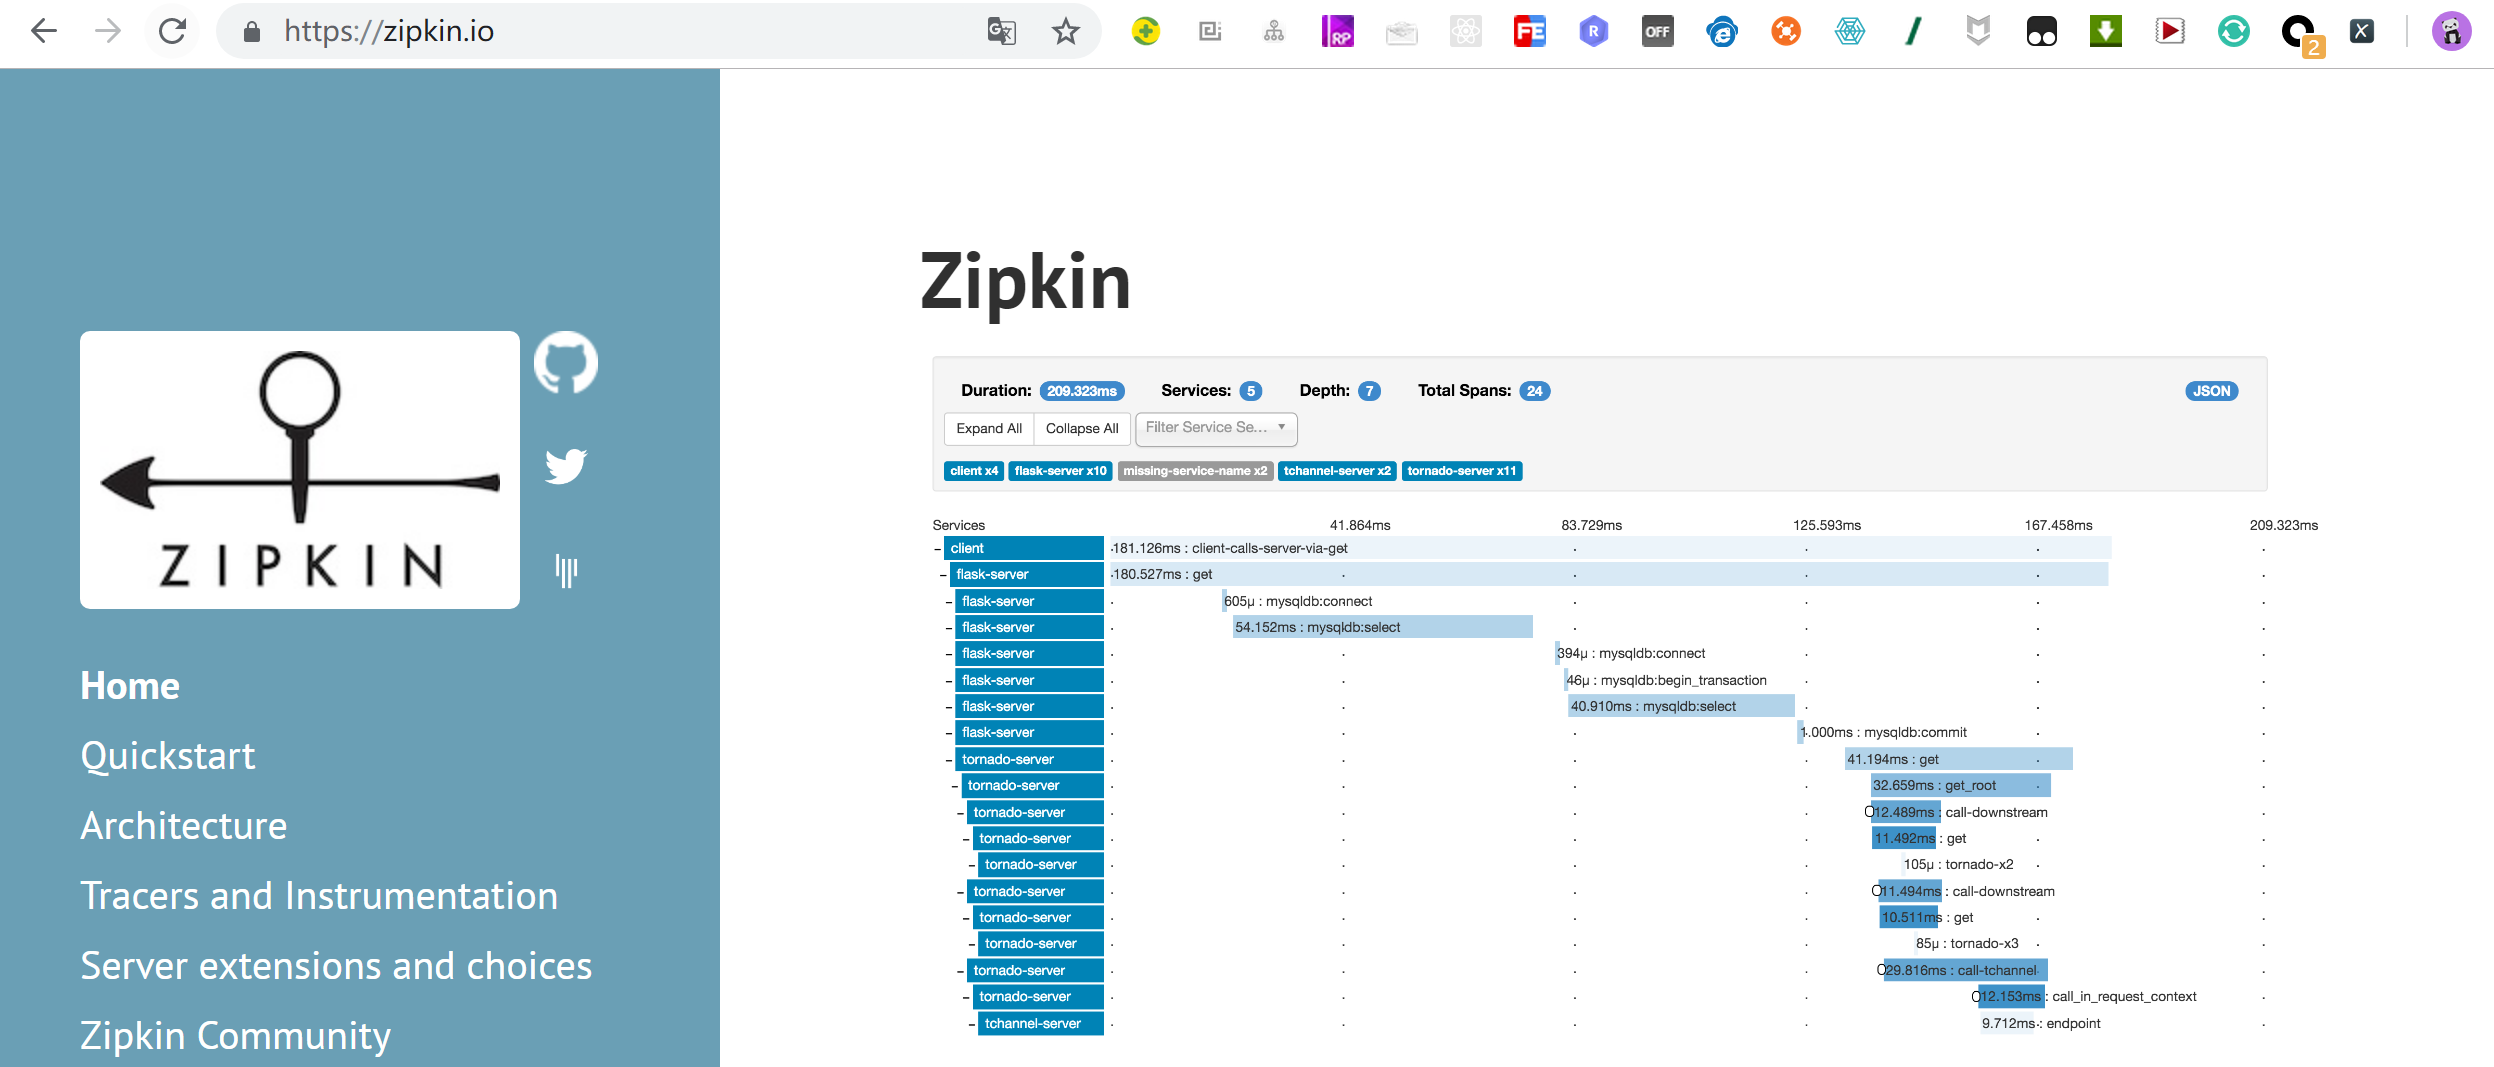
Zipkin简介(四)
Zipkin是 Twitter开源的分布式跟踪系统,基于 Dapper的论文设计而来。它的主要功能是收集系统的时序数据,从而追踪微服务架构的系统延时等问题。 Zipkin还提供了一个非常友好的界面,来帮助分析追踪数据。它可以收集springcloud中sleuth的信息。
- ① 官网
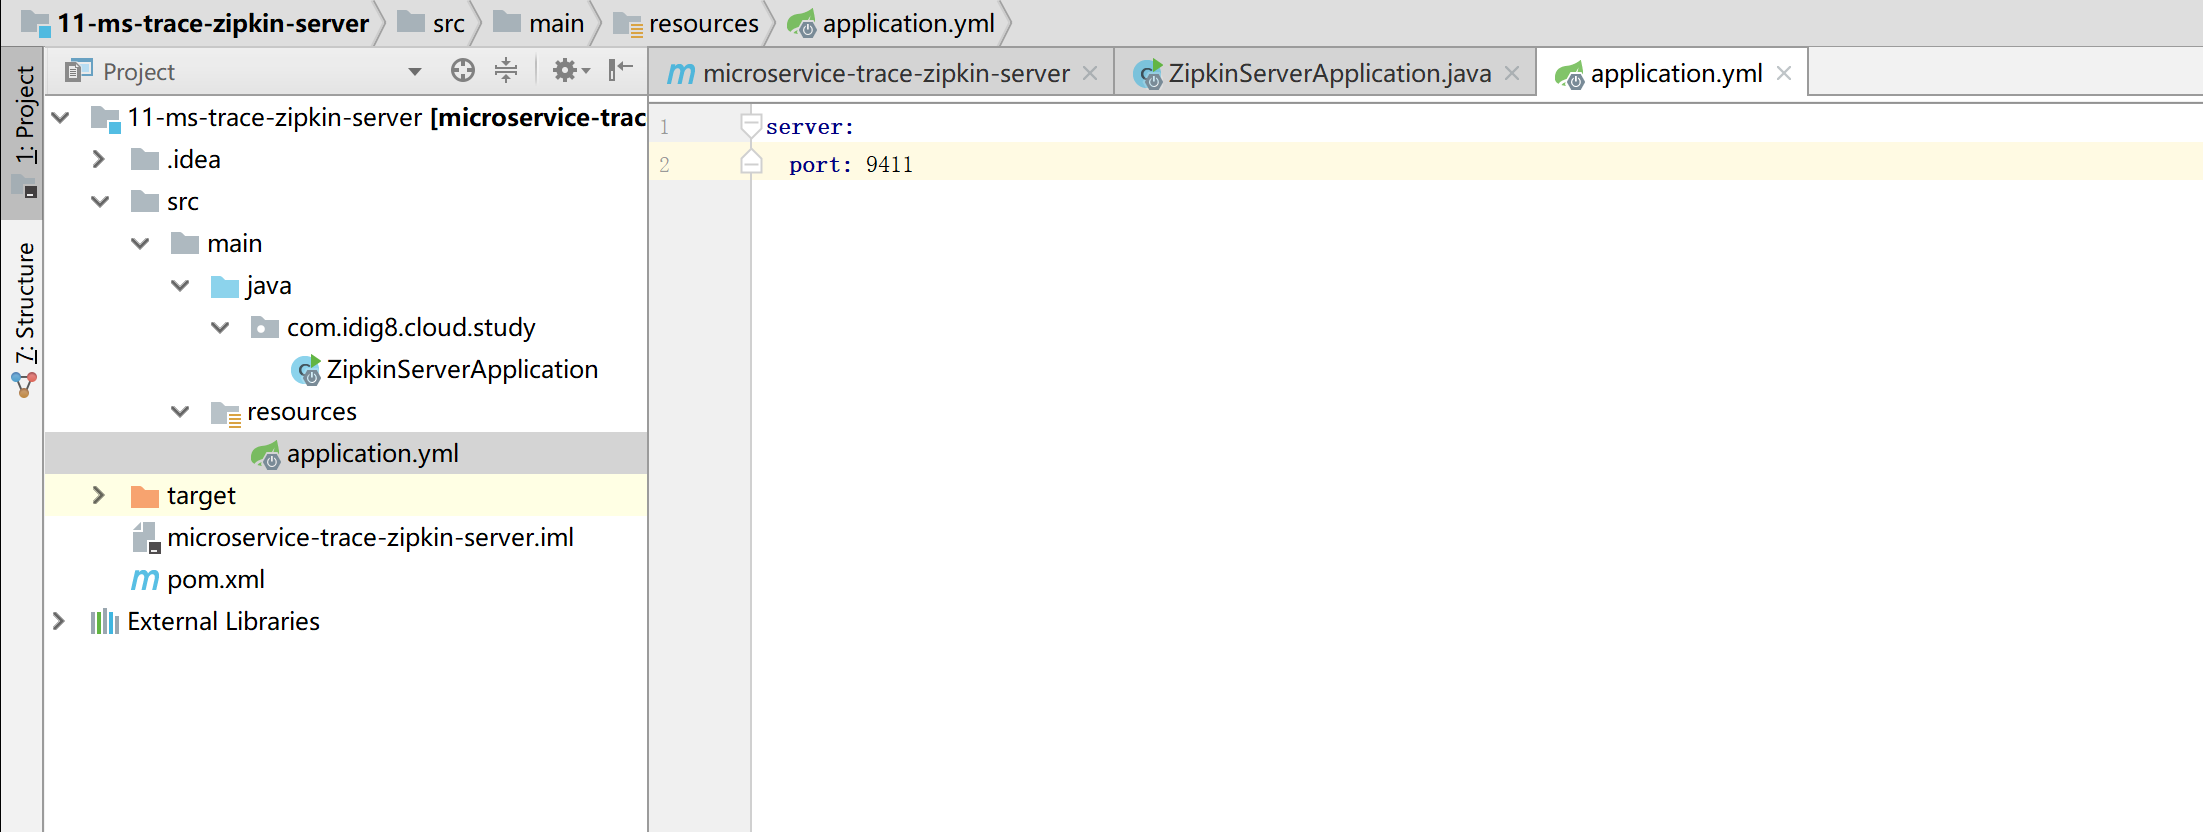
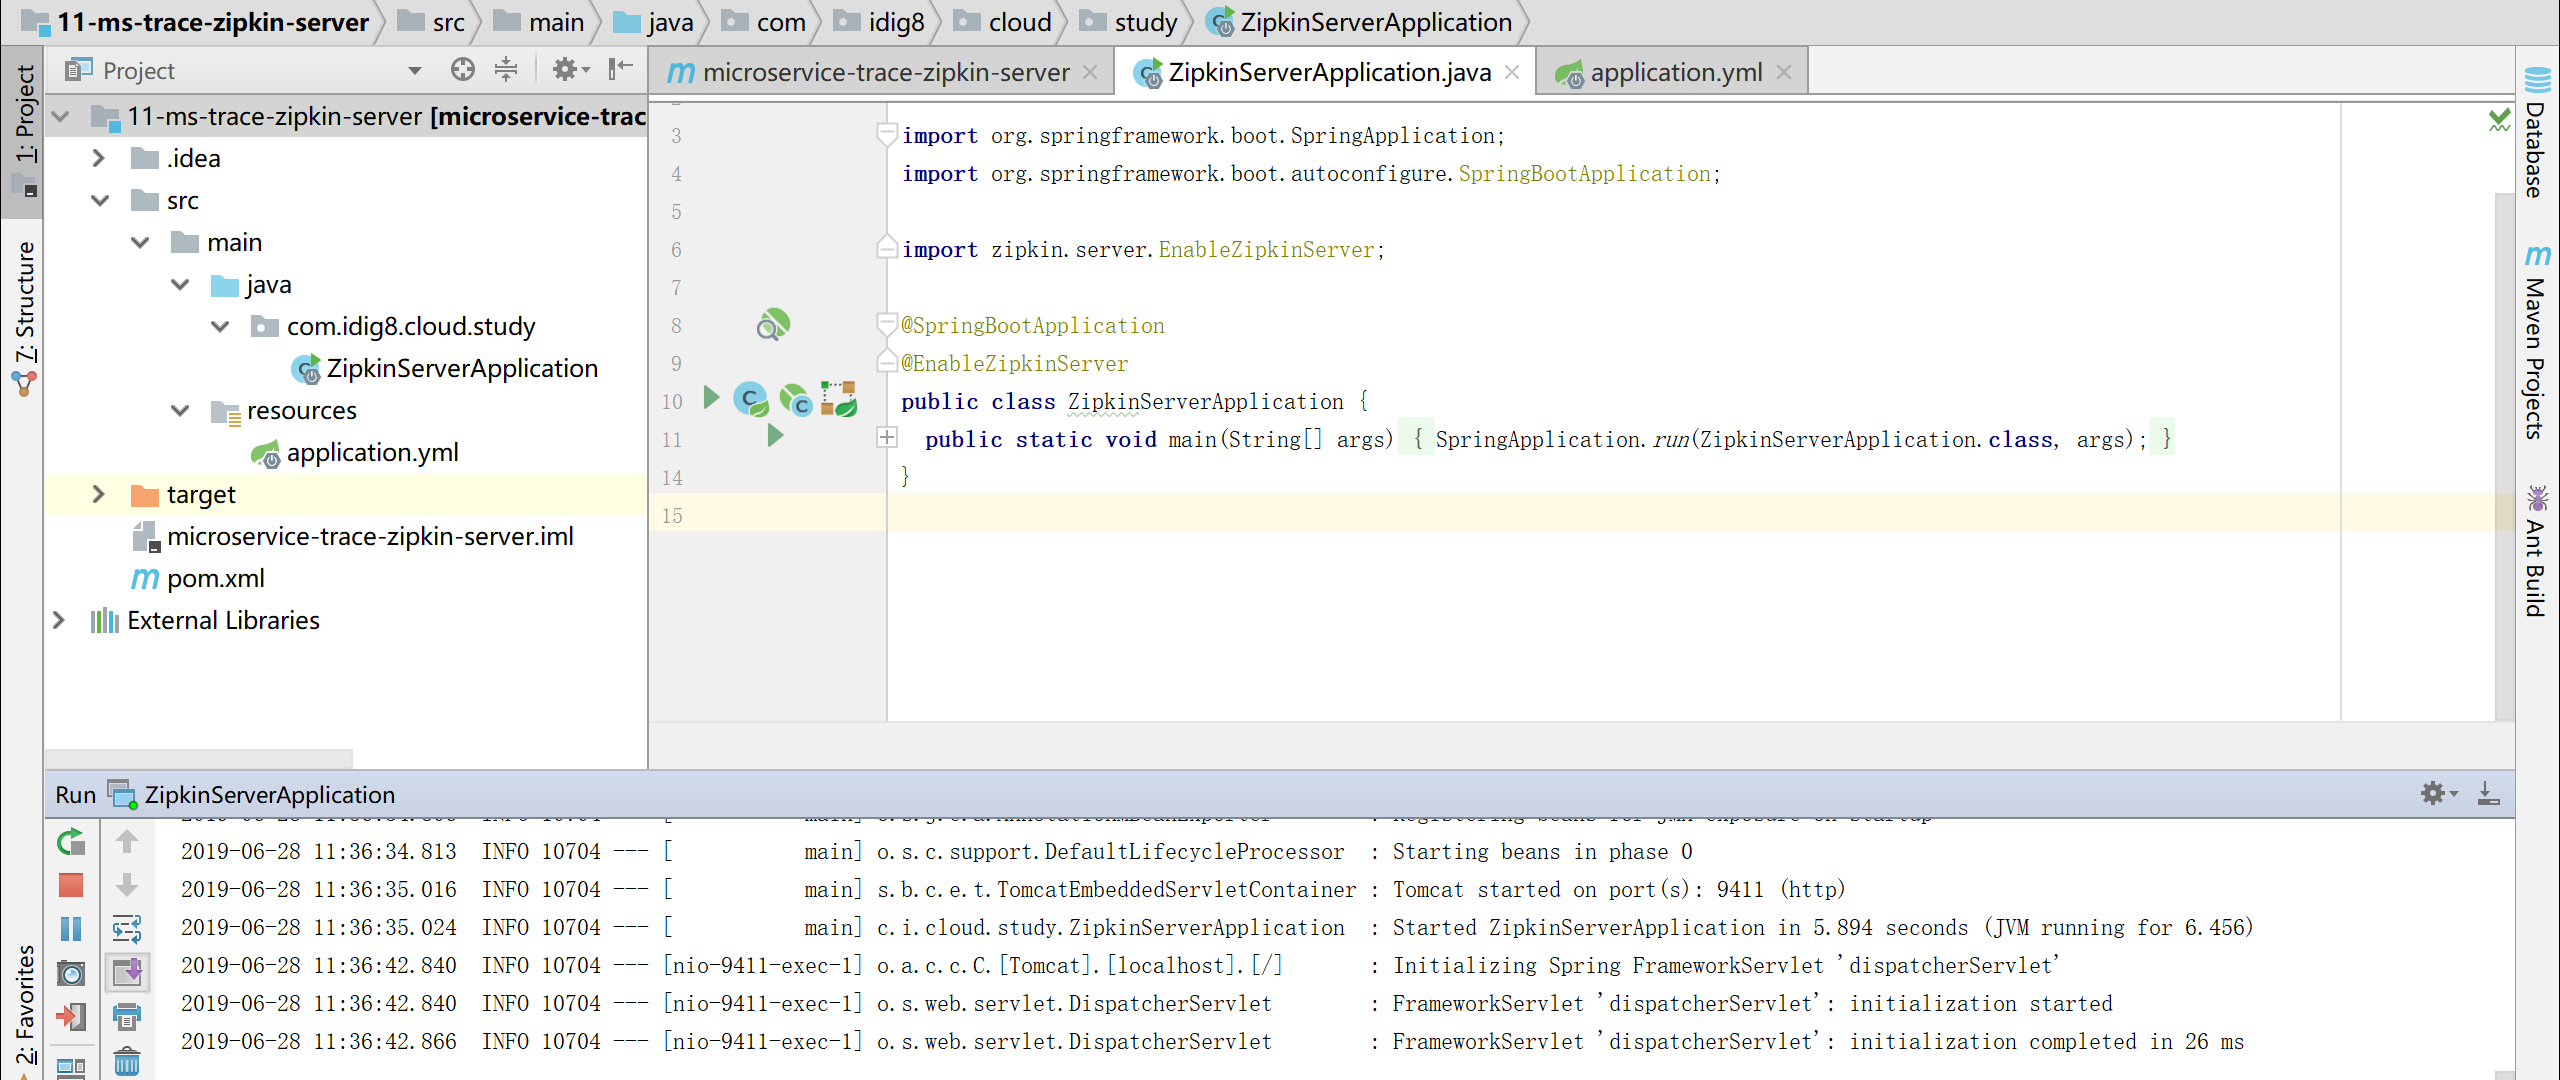
- ② 编写Zipkin Server
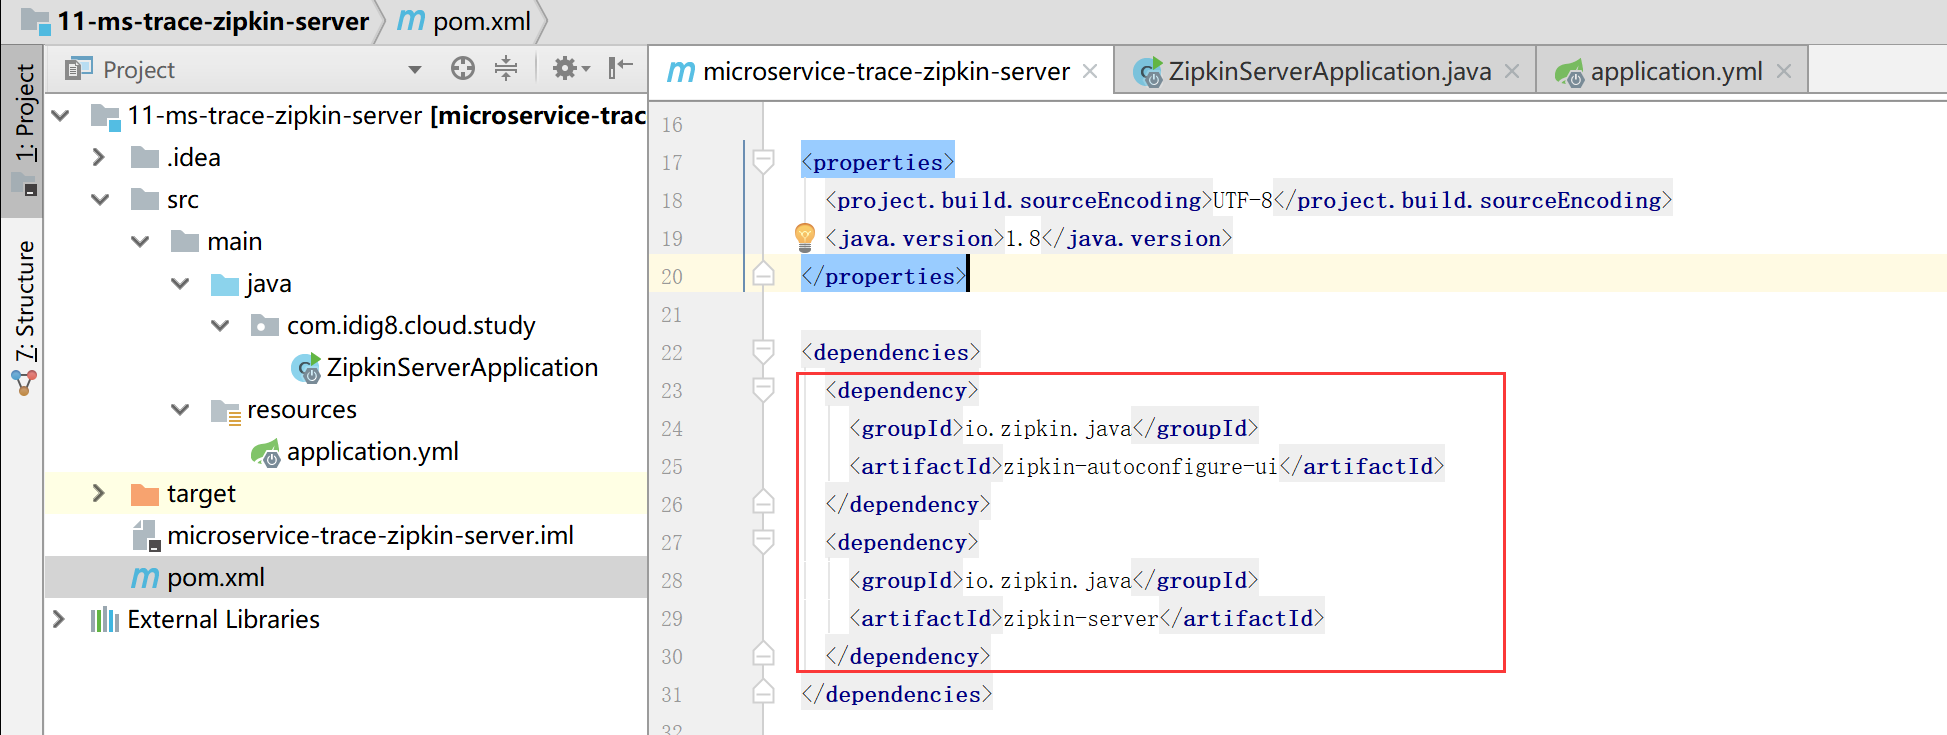
源码:11-ms-trace-zipkin-server
添加依赖
<dependency>
      <groupId>io.zipkin.java</groupId>
      <artifactId>zipkin-autoconfigure-ui</artifactId>
    </dependency>
    <dependency>
      <groupId>io.zipkin.java</groupId>
      <artifactId>zipkin-server</artifactId>
    </dependency>
添加注解@EnableZipkinServer
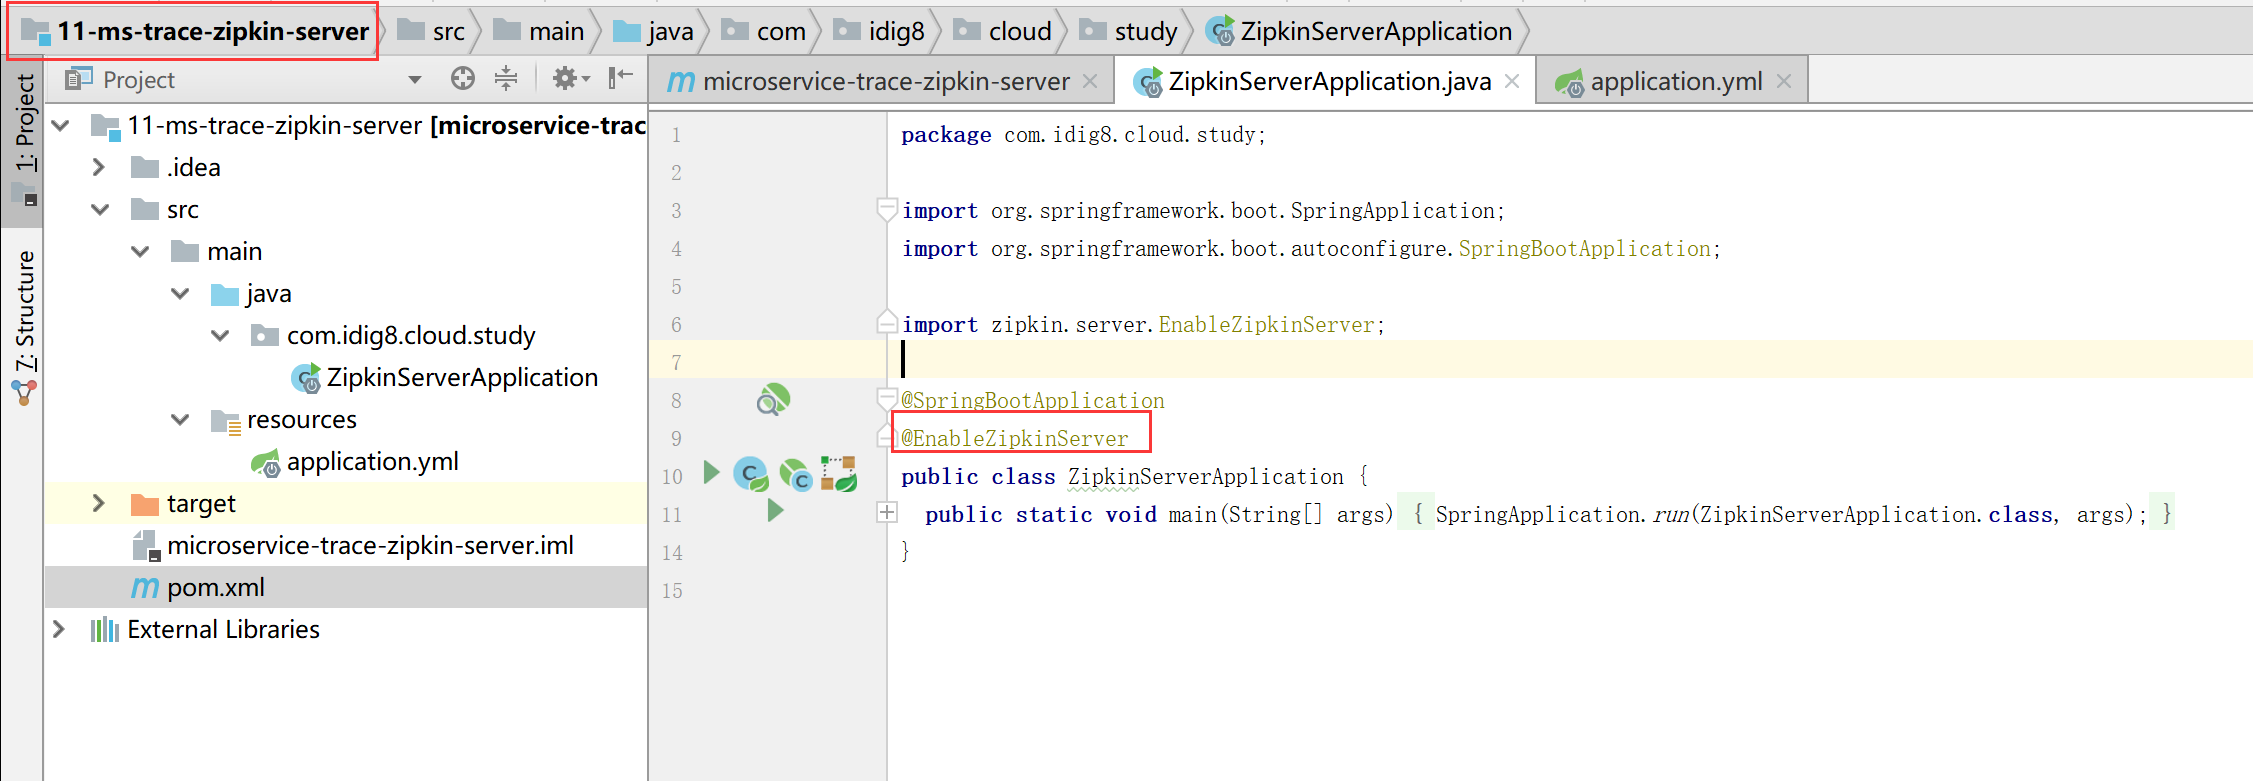
启动项目,访问地址:http://localhost:9411/zipkin/
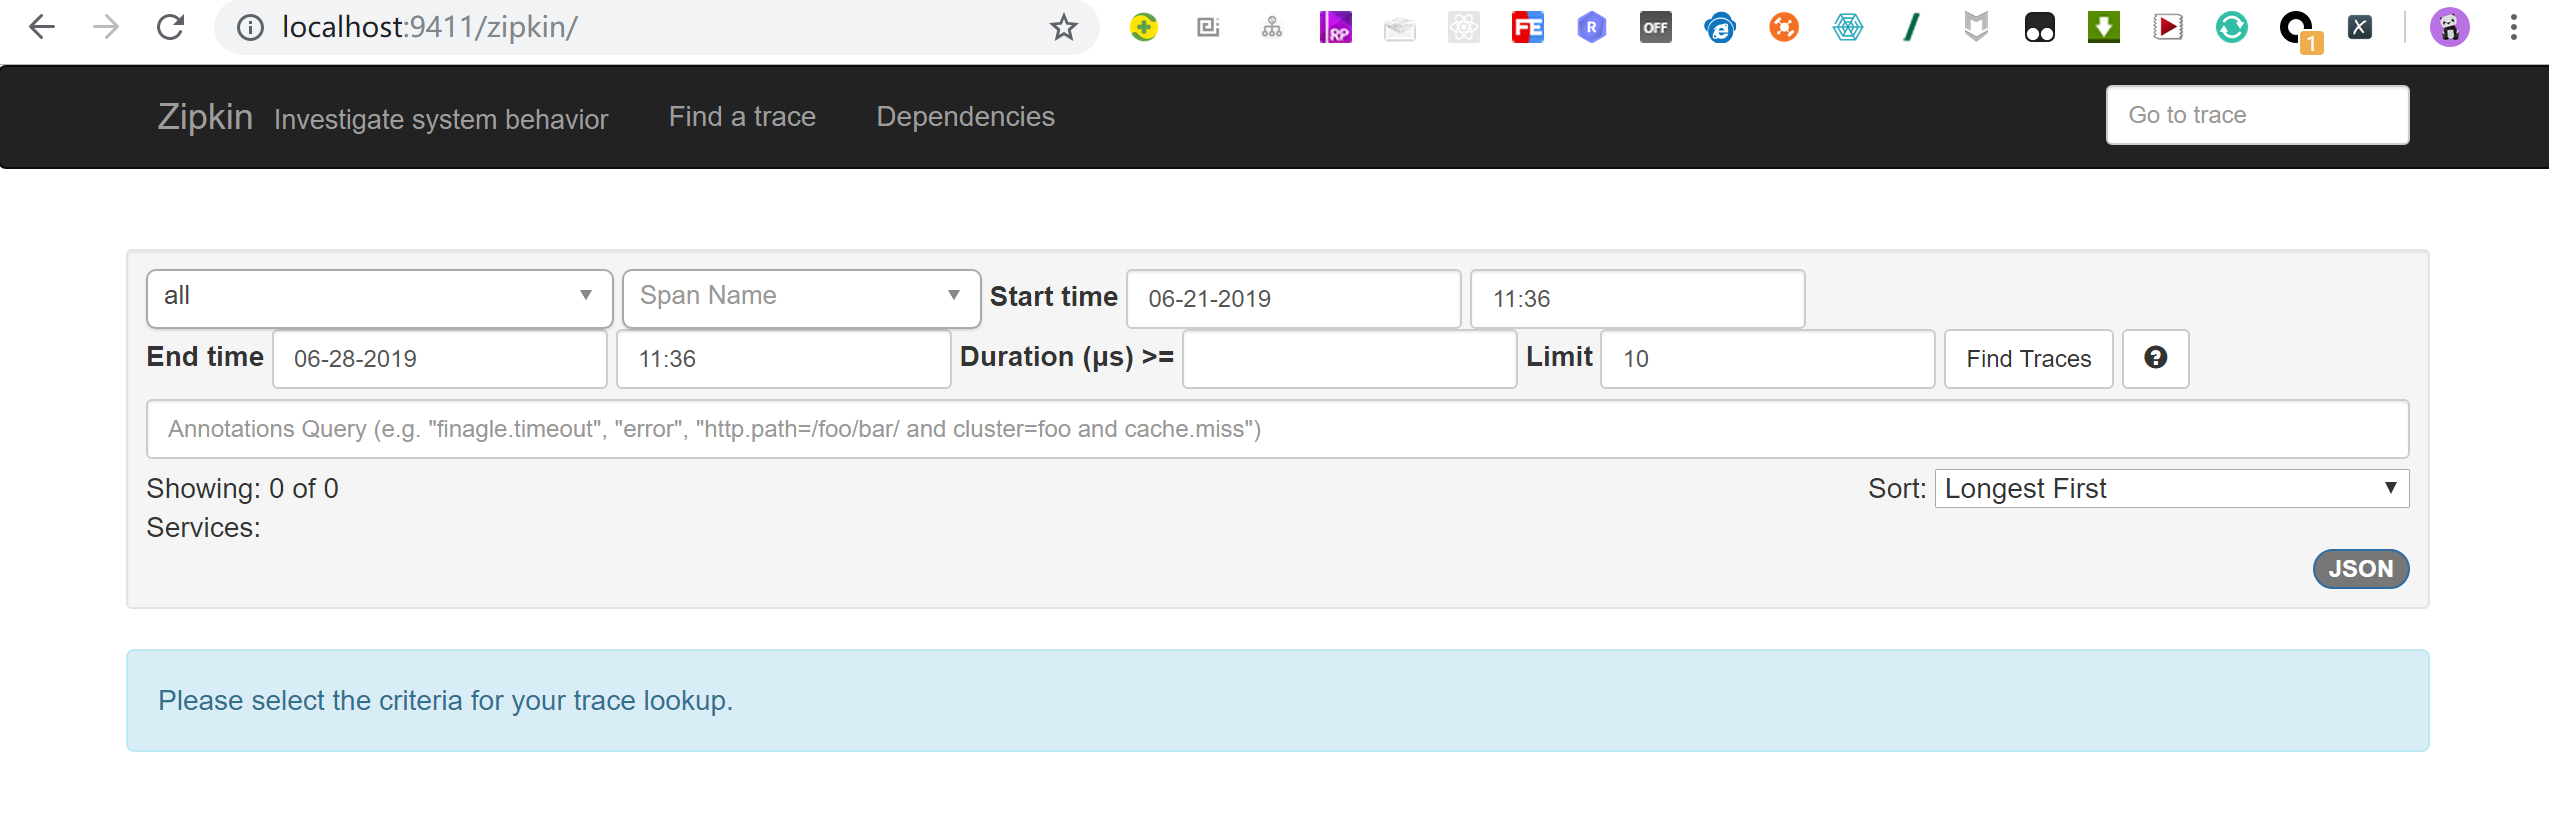
第一列Service Name,也就是各个微服务spring.application.name的值。 第二列表示Span的名称,all表示所有。 Start time和End time,分别用于指定起始时间和截止时间。 Duration表示持续时间,即Span从创建到关闭所经历的时间。 Limit表示查询几条数据。类似于 MySQL数据库中的 limit关键词。Annotations Query,用于自定义查询条件。
微服务整合Zipkin (五)
用户和订单微服务整合Zipkin
- ① 源码
11-ms-simple-provider-user-trace-zipkin 11-ms-simple-consumer-order-trace-zipkin
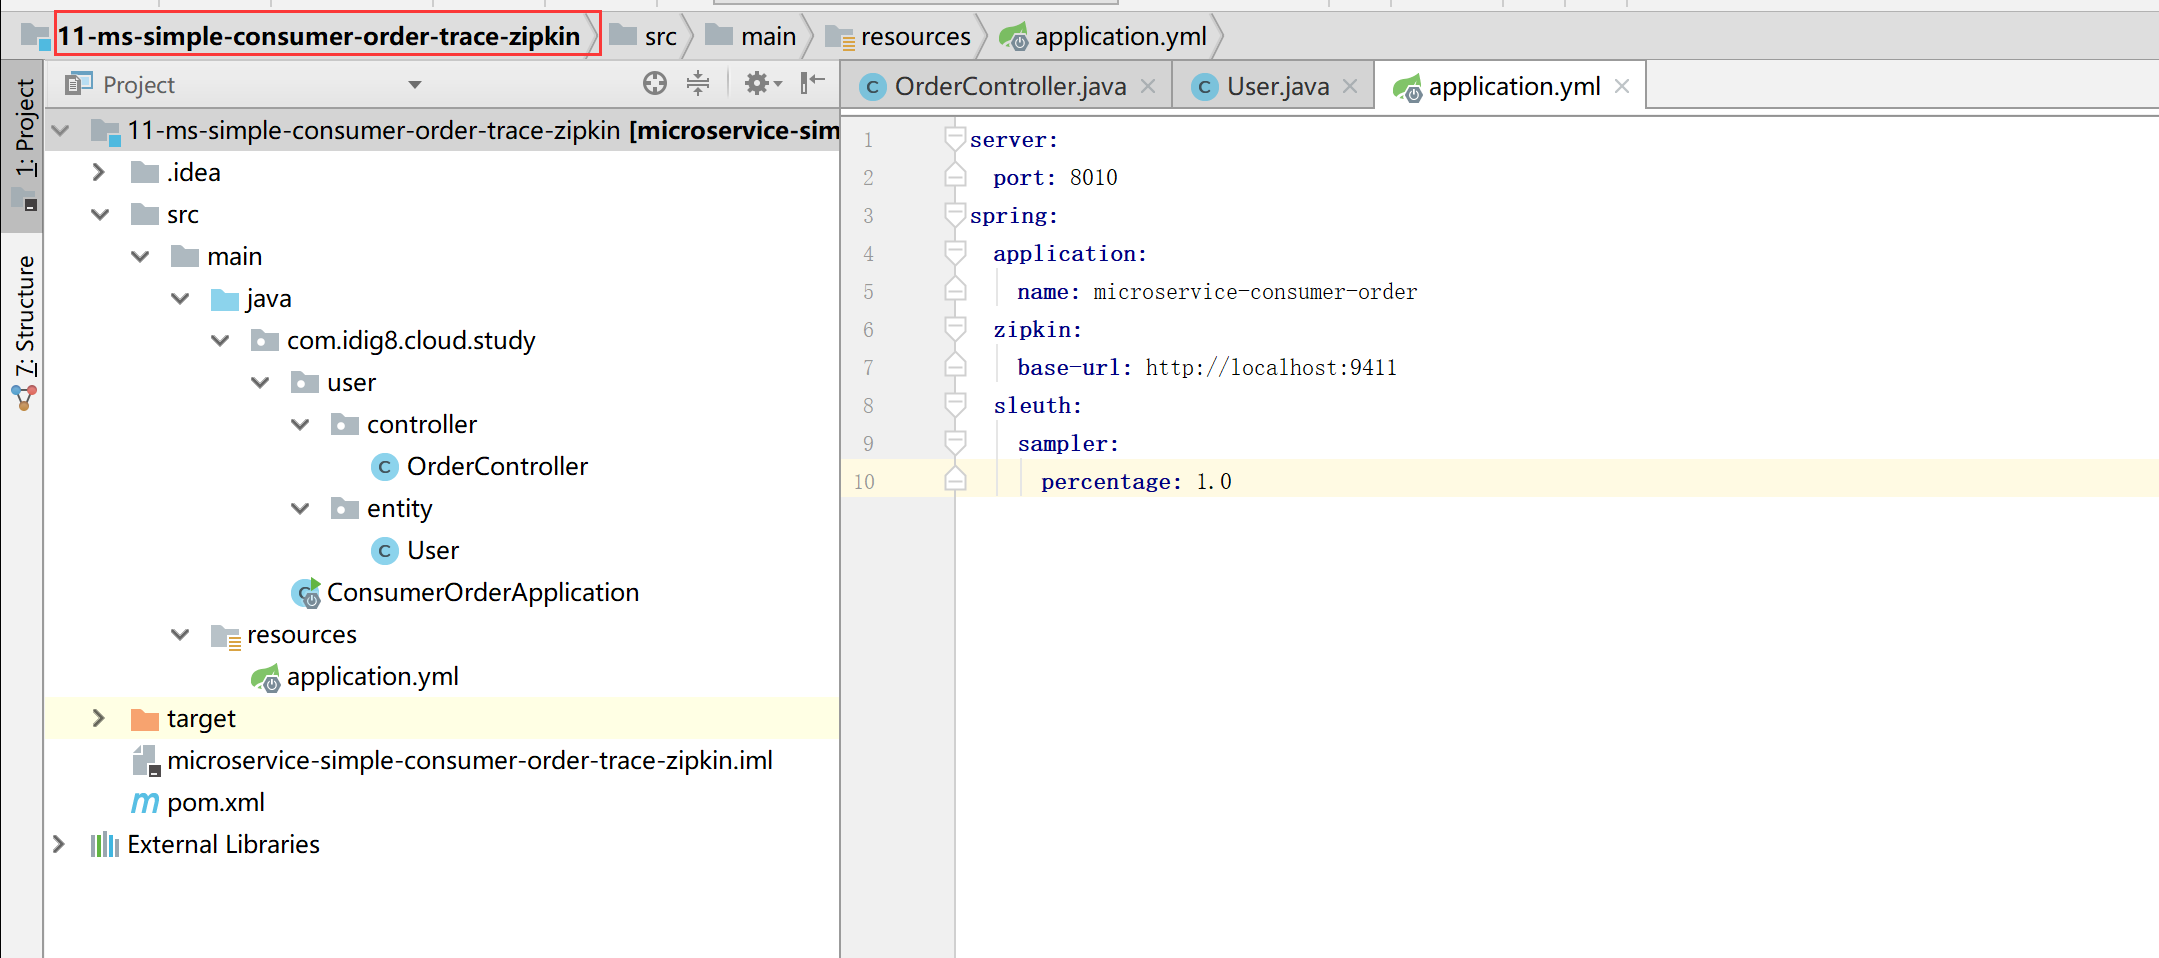
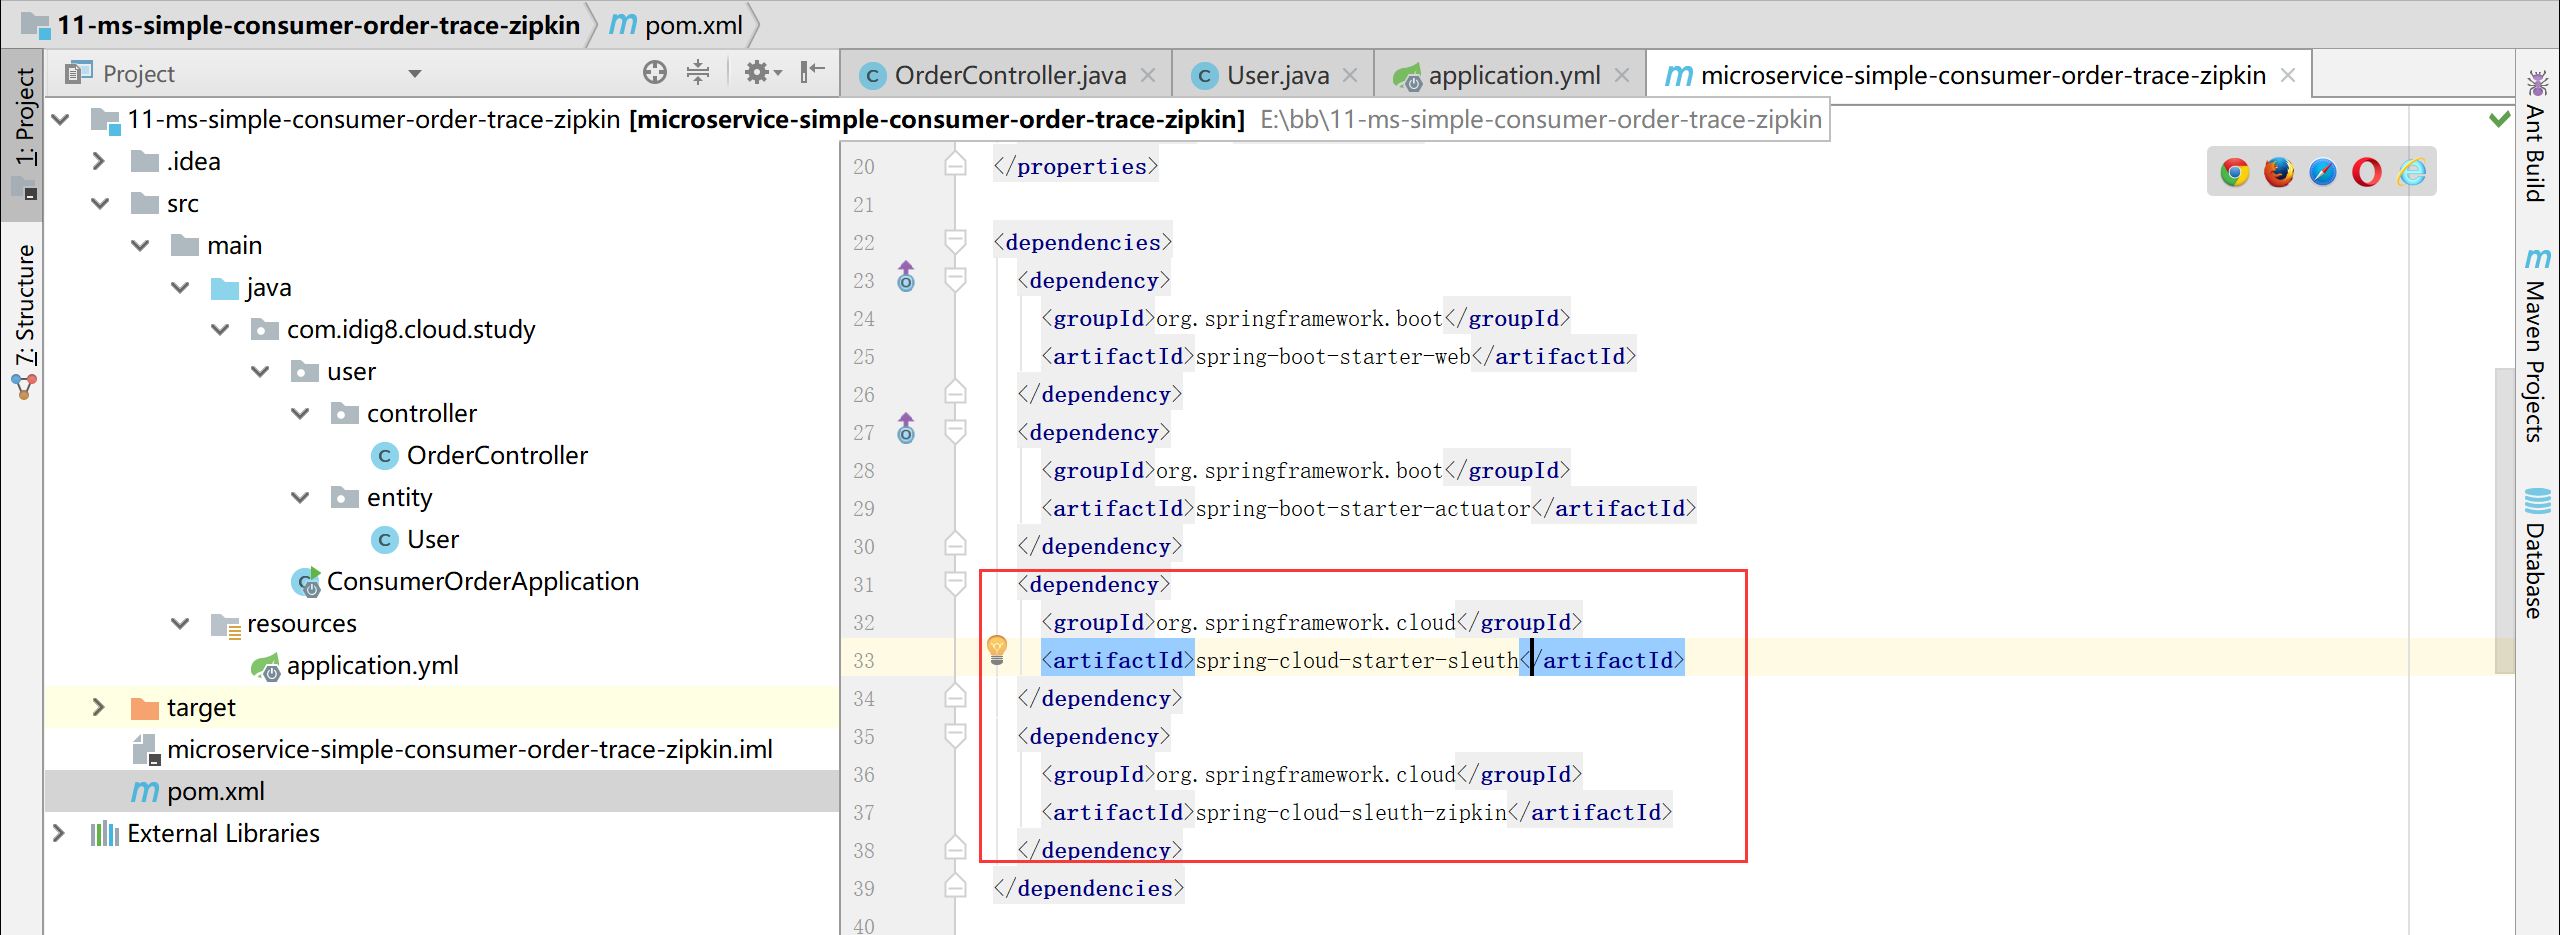
- ② 添加依赖
    <dependency>
      <groupId>org.springframework.cloud</groupId>
      <artifactId>spring-cloud-starter-sleuth</artifactId>
    </dependency>
    <dependency>
      <groupId>org.springframework.cloud</groupId>
      <artifactId>spring-cloud-sleuth-zipkin</artifactId>
    </dependency>
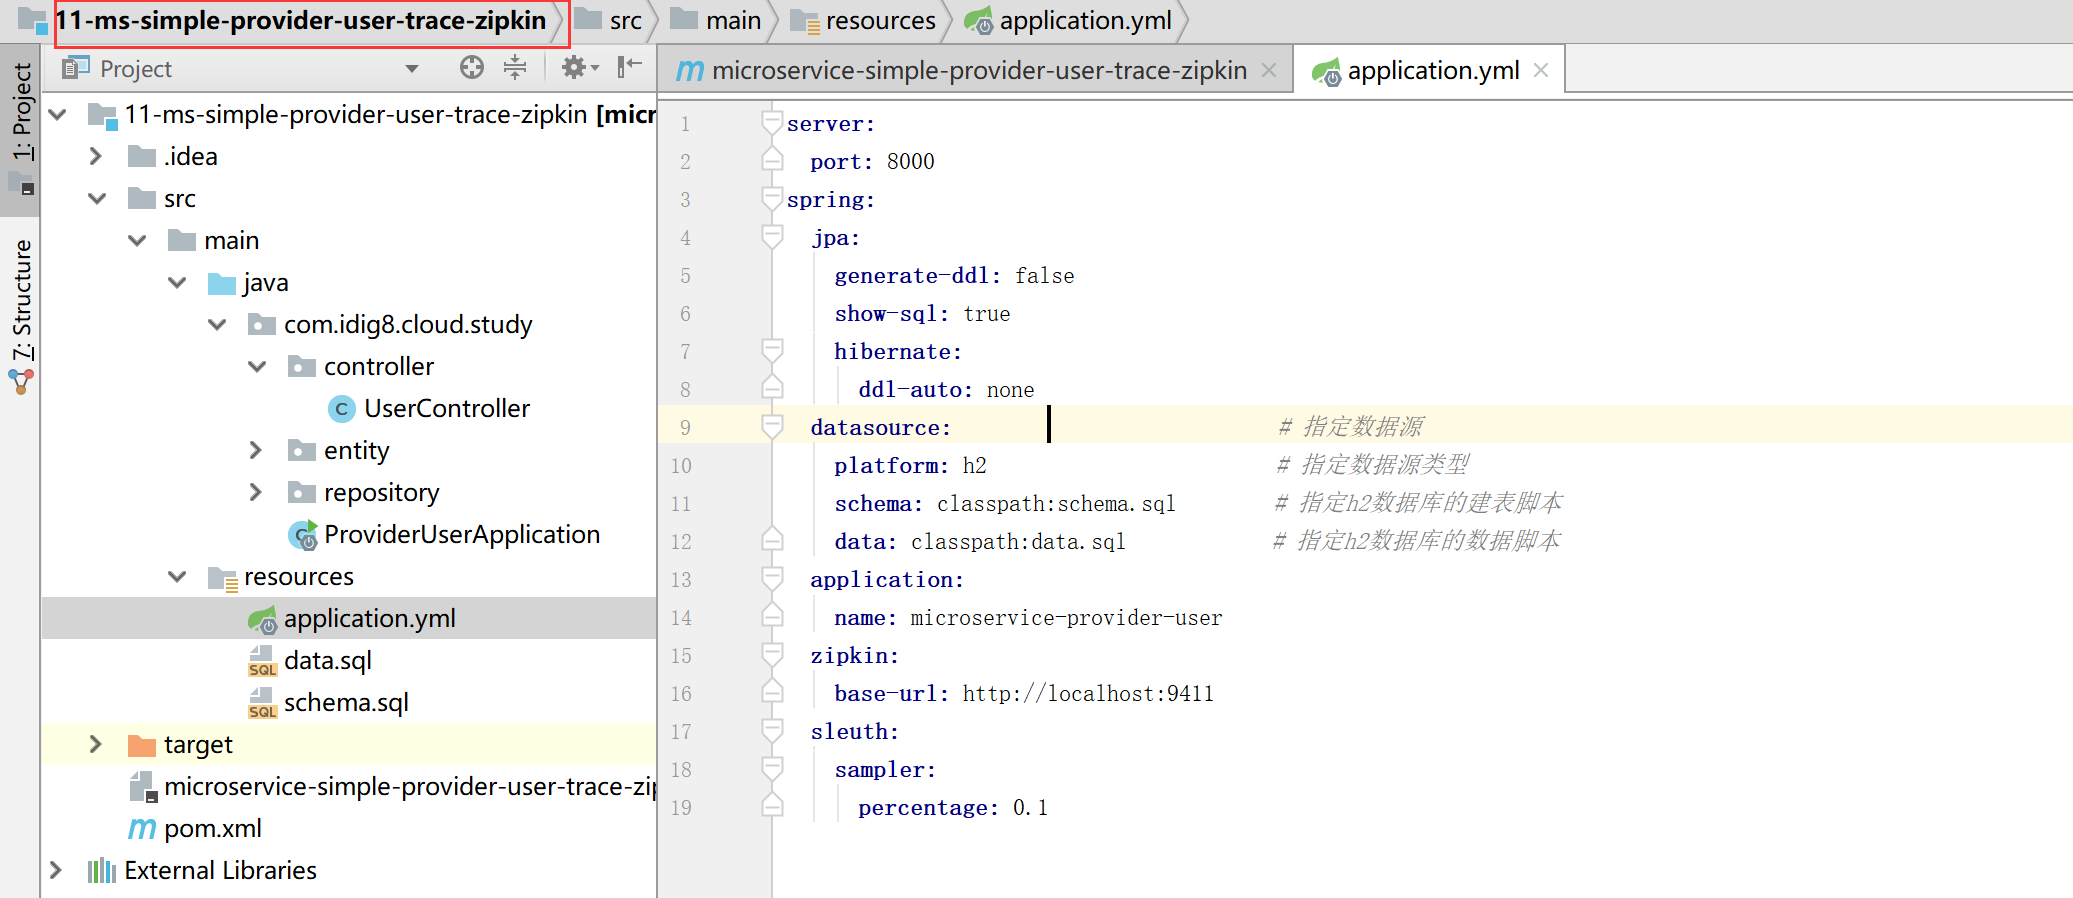
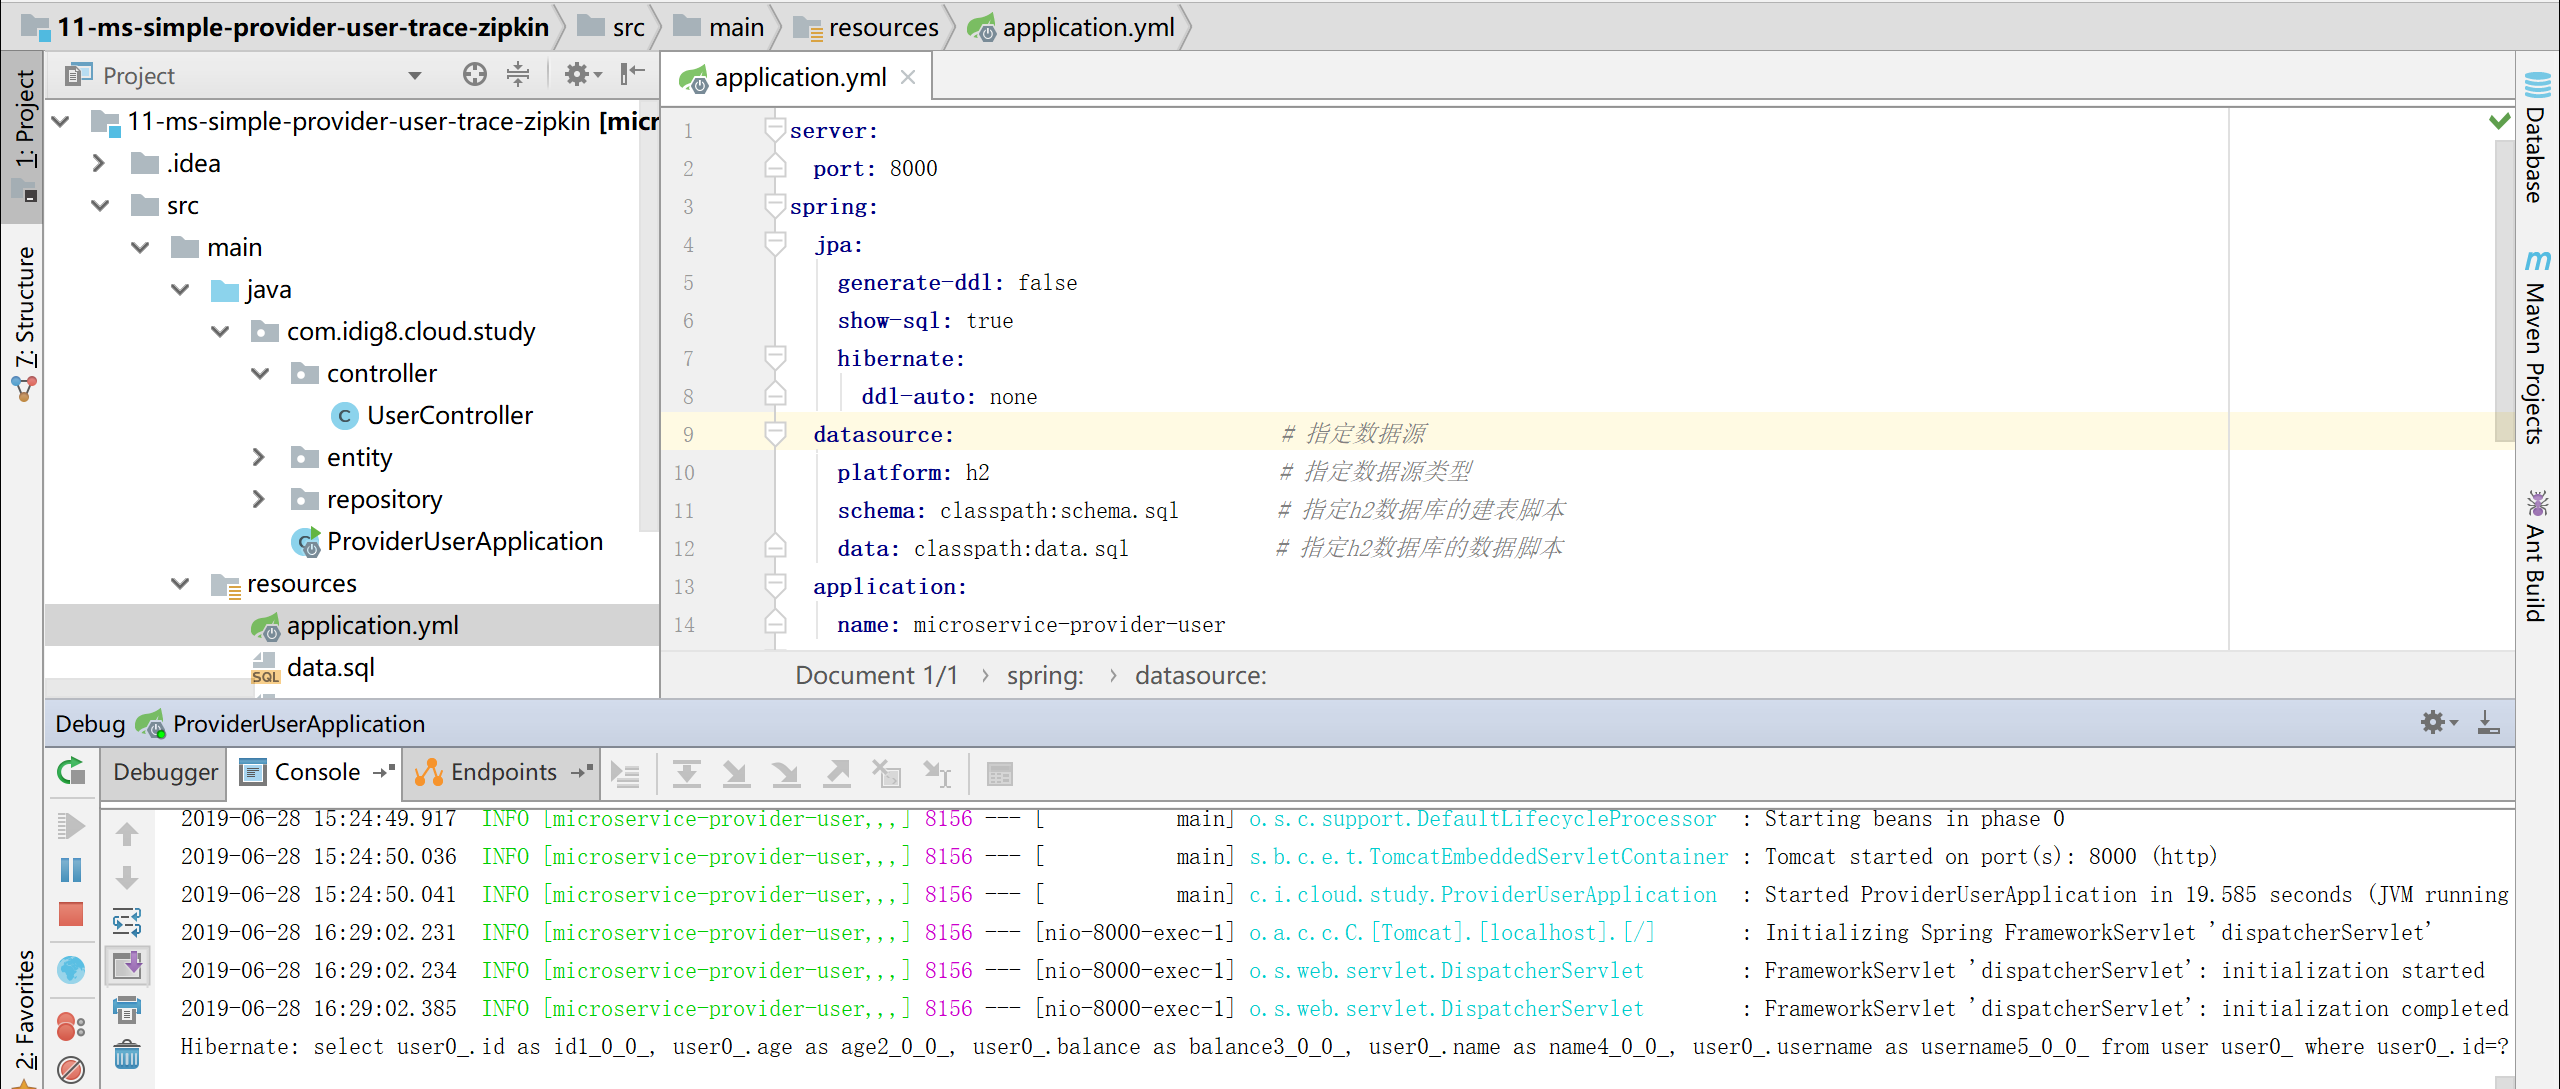
11-ms-simple-provider-user-trace-zipkin 配置文件中新增如下内容
server:
  port: 8000
spring:
  jpa:
    generate-ddl: false
    show-sql: true
    hibernate:
      ddl-auto: none
  datasource:                           # 指定数据源
    platform: h2                        # 指定数据源类型
    schema: classpath:schema.sql        # 指定h2数据库的建表脚本
    data: classpath:data.sql            # 指定h2数据库的数据脚本
  application:
    name: microservice-provider-user
  zipkin:
    base-url: http://localhost:9411
  sleuth:
    sampler:
      percentage: 0.1
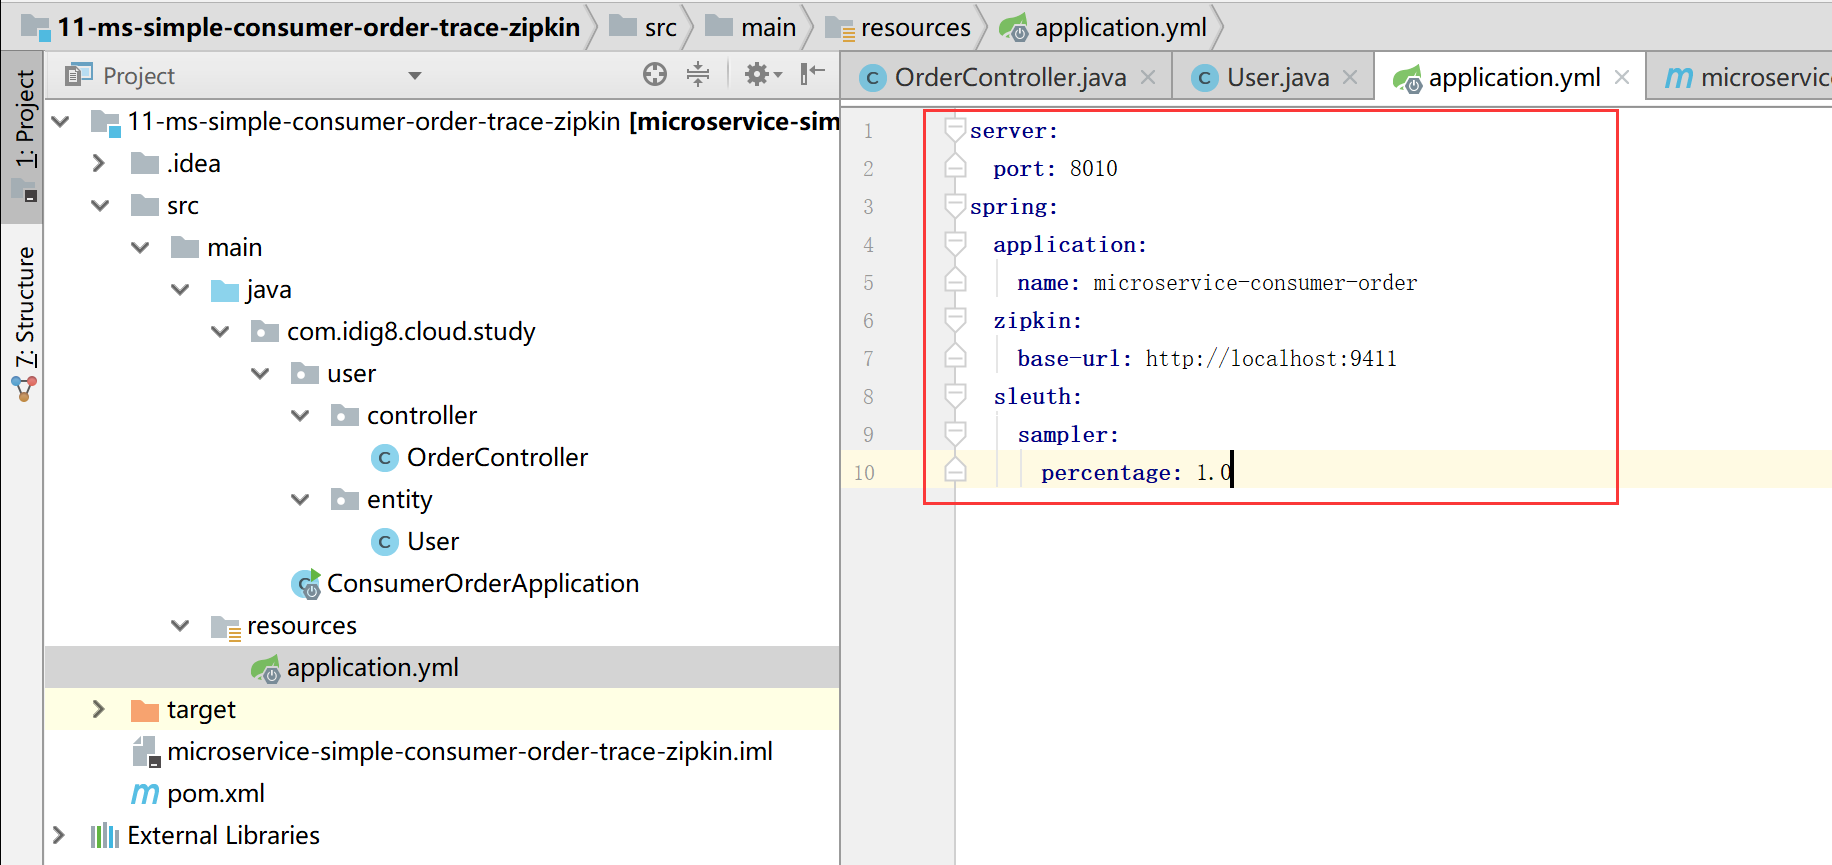
11-ms-simple-consumer-order-trace-zipkin 配置文件中新增如下内容
server:
  port: 8000
spring:
  jpa:
    generate-ddl: false
    show-sql: true
    hibernate:
      ddl-auto: none
  datasource:                           # 指定数据源
    platform: h2                        # 指定数据源类型
    schema: classpath:schema.sql        # 指定h2数据库的建表脚本
    data: classpath:data.sql            # 指定h2数据库的数据脚本
  application:
    name: microservice-provider-user
  zipkin:
    base-url: http://localhost:9411
  sleuth:
    sampler:
      percentage: 0.1
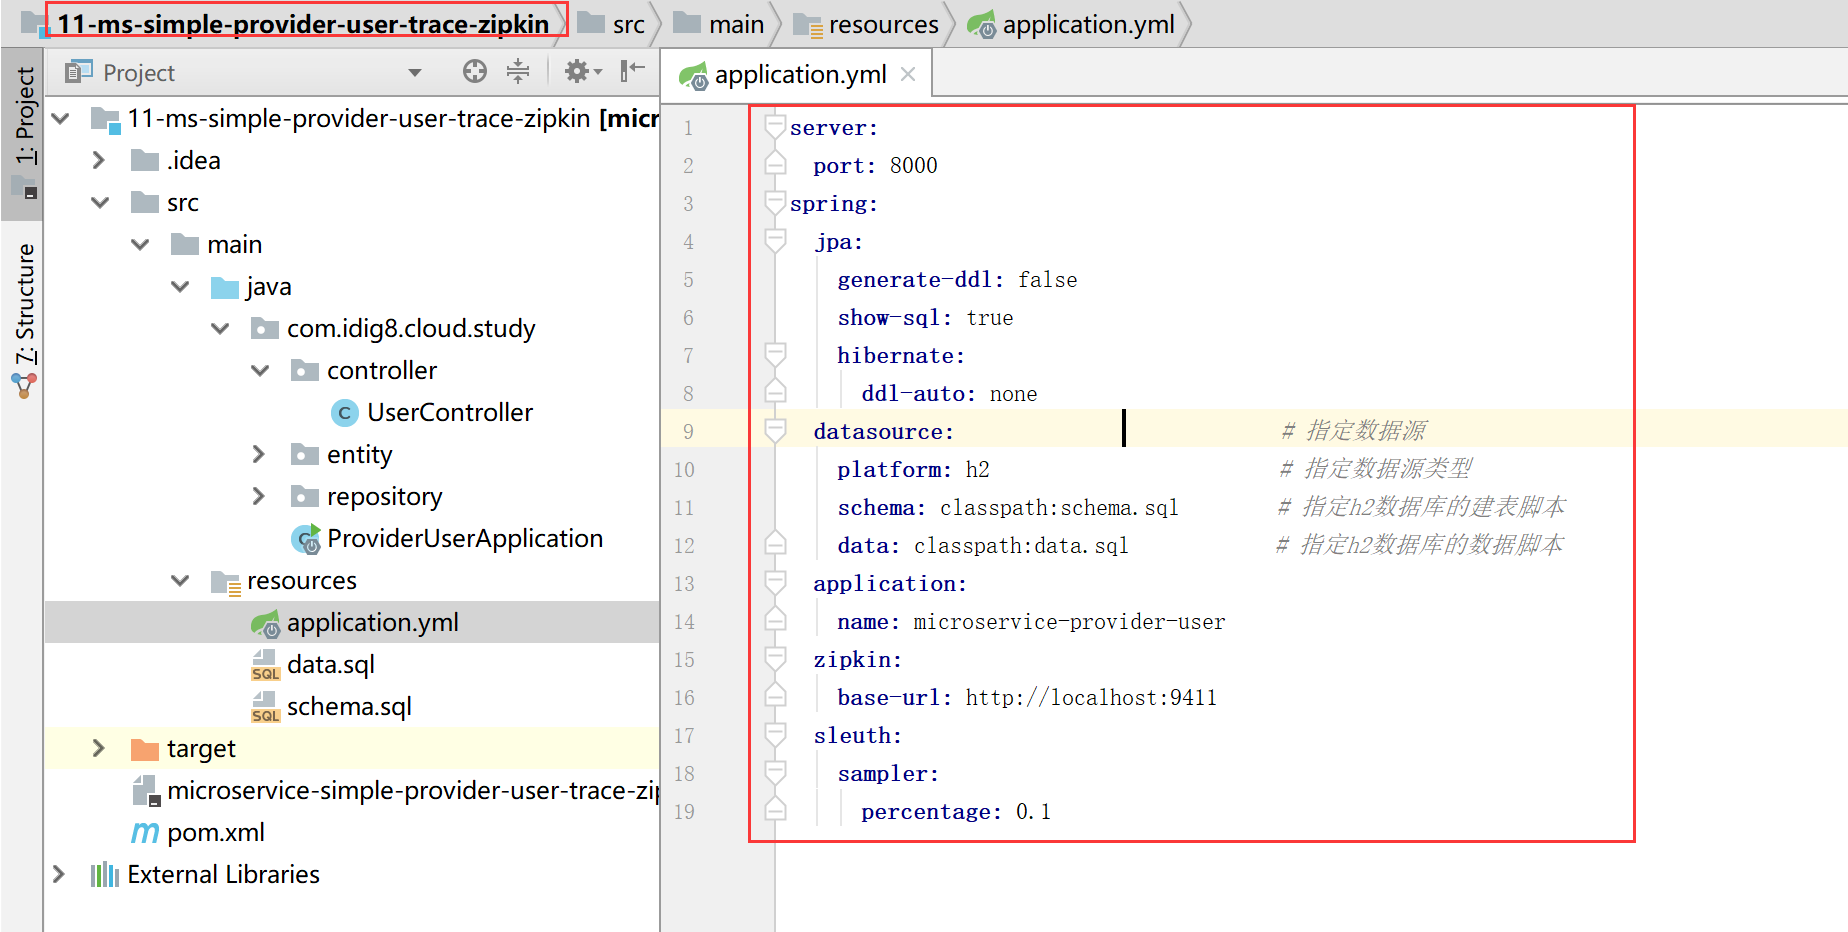
- ③ spring.zipkin.base-url
指定Zipkin的地址。
- spring.sleuth.sampler.percentage
指定需采样的请求的百分比,默认值是0.1,即10%。这是因为在分布式系统中,数据量可能会非常大,因此采样非常重要。但是我们示例数据少最好配置为1全采样。
- ④ 启动项目
11-ms-simple-provider-user-trace-zipkin 11-ms-simple-consumer-order-trace-zipkin 11-ms-trace-zipkin-server

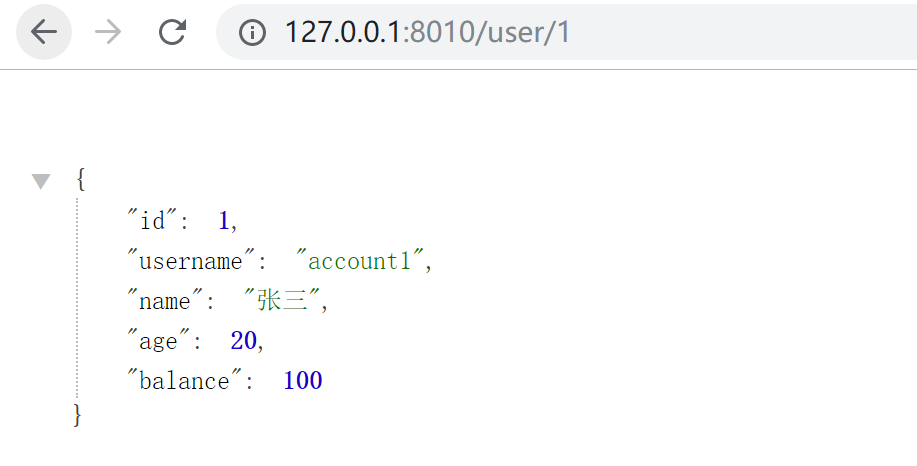
访问url :http://127.0.0.1:8010/user/1
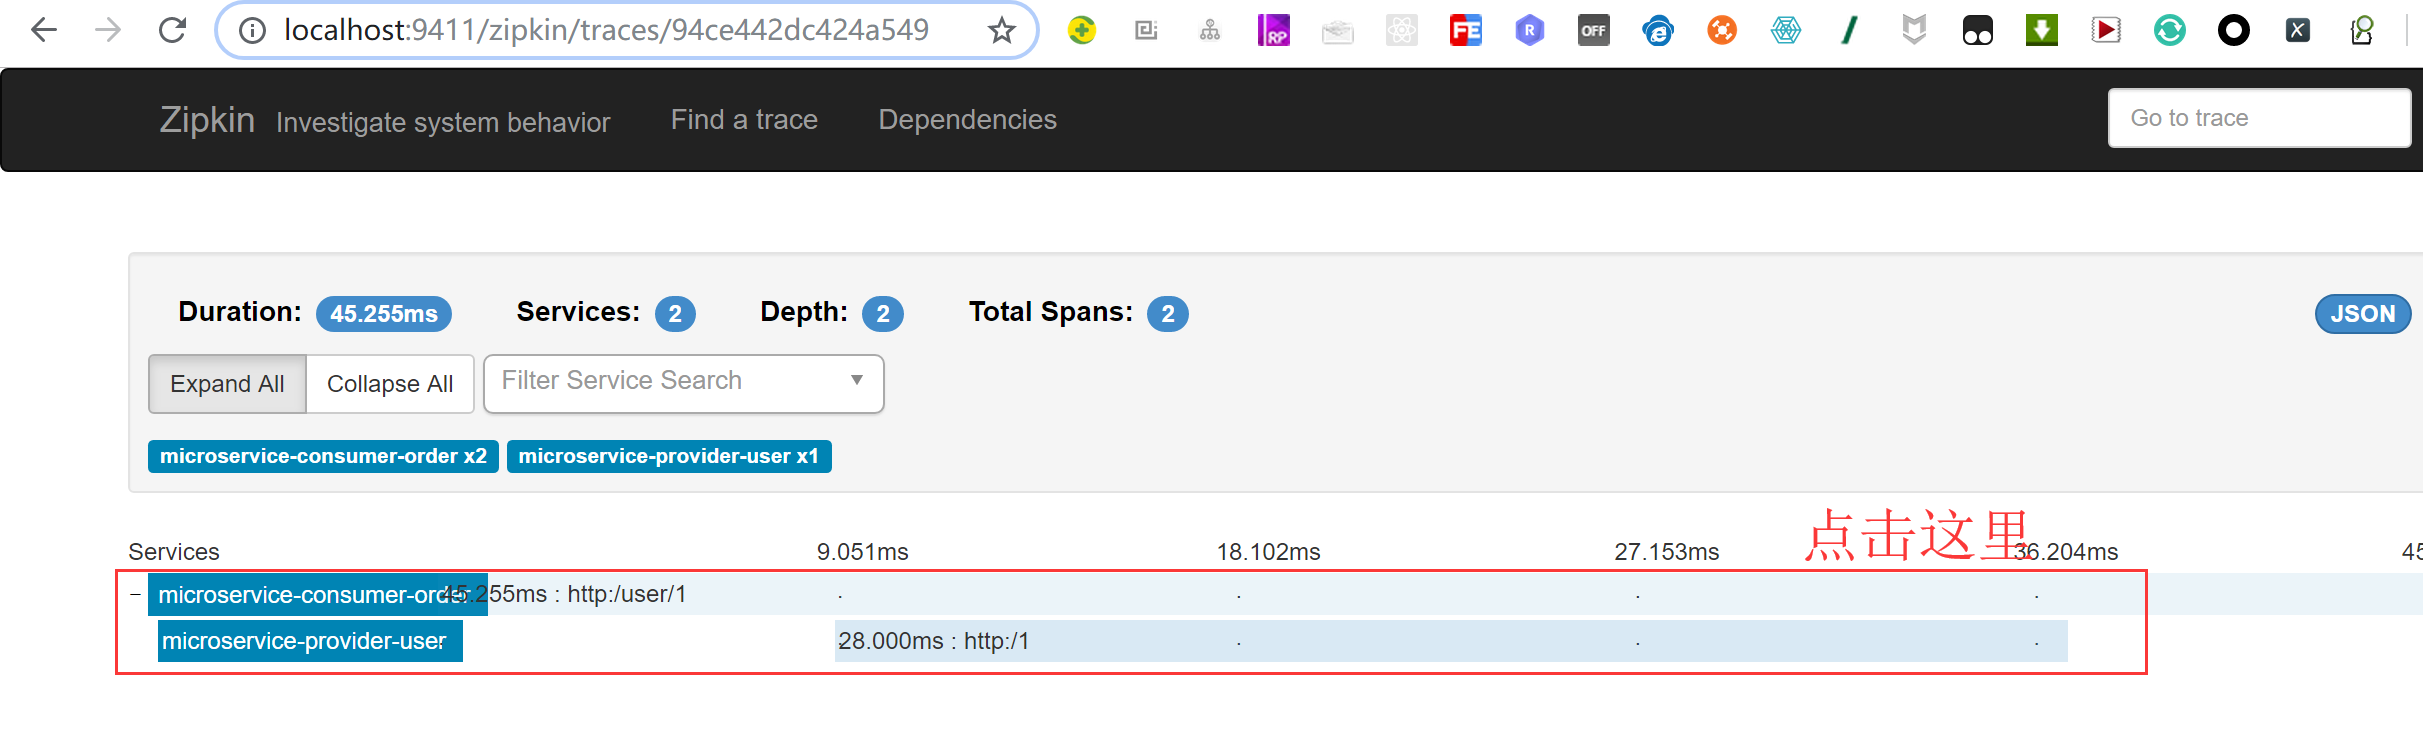
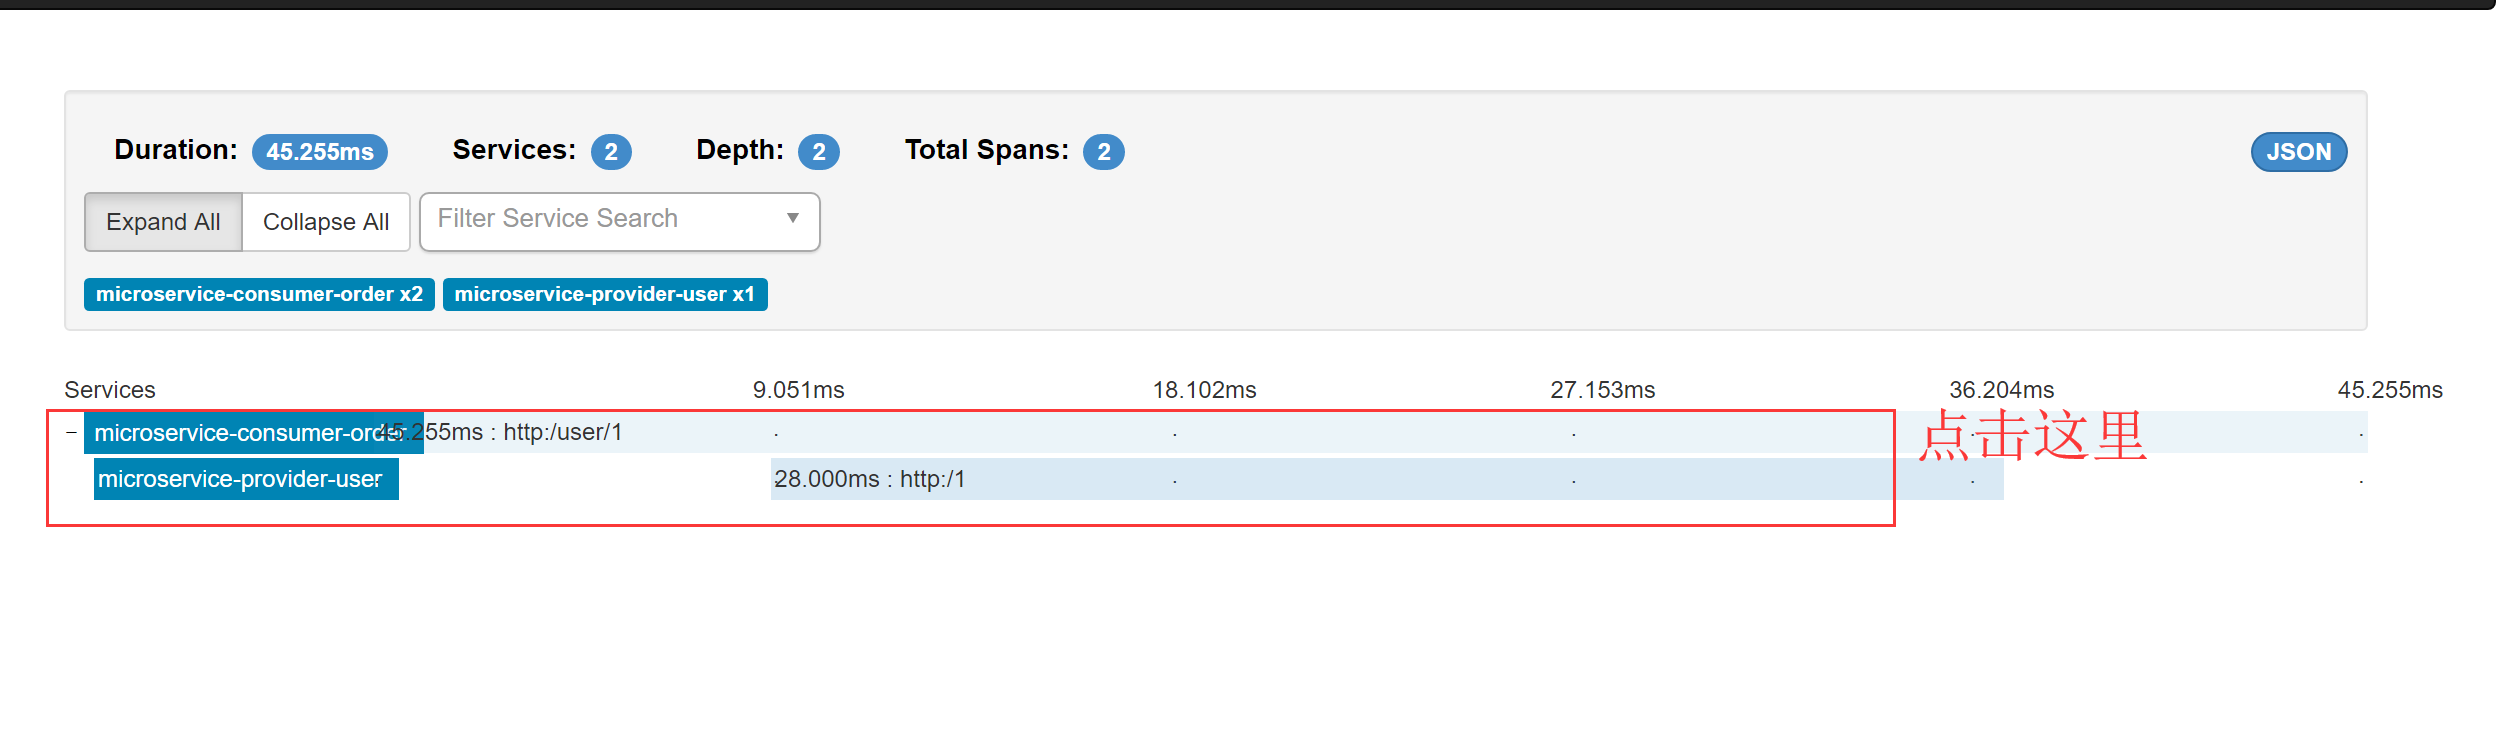
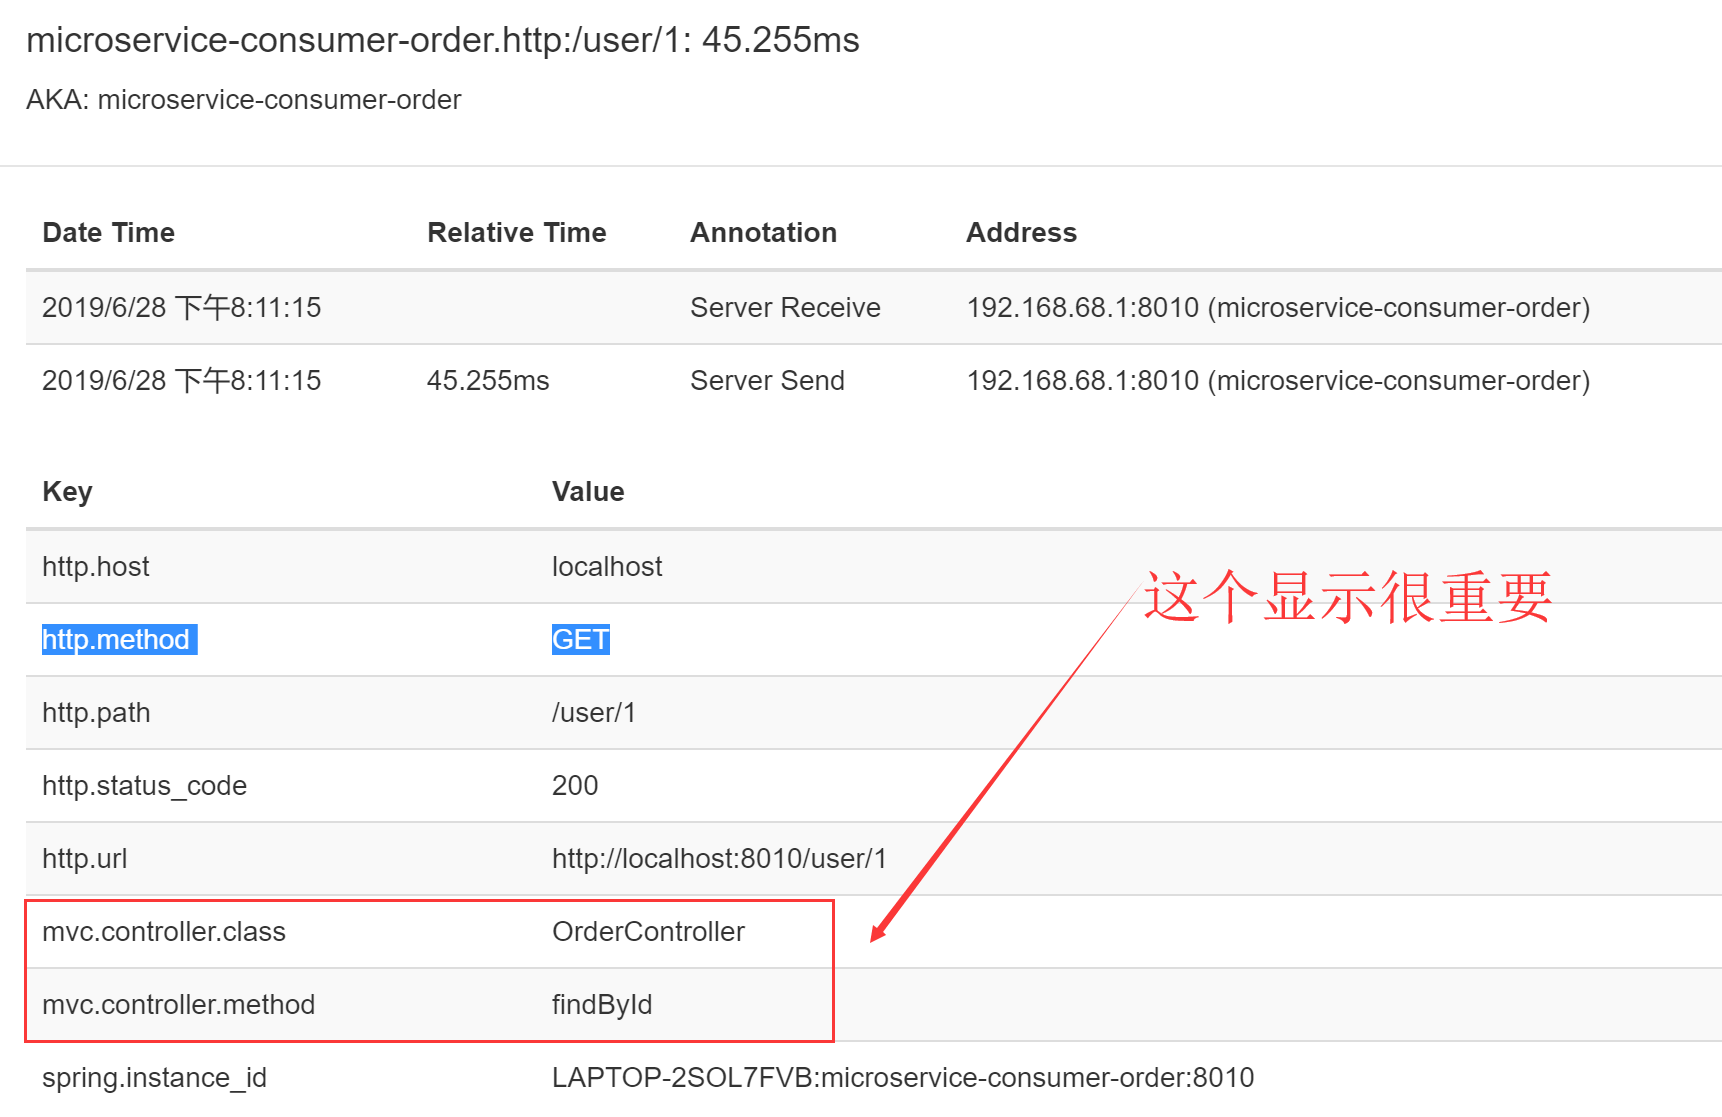
访问url :http://localhost:9411/zipkin/ 能查询到微服务调用的跟踪日志。
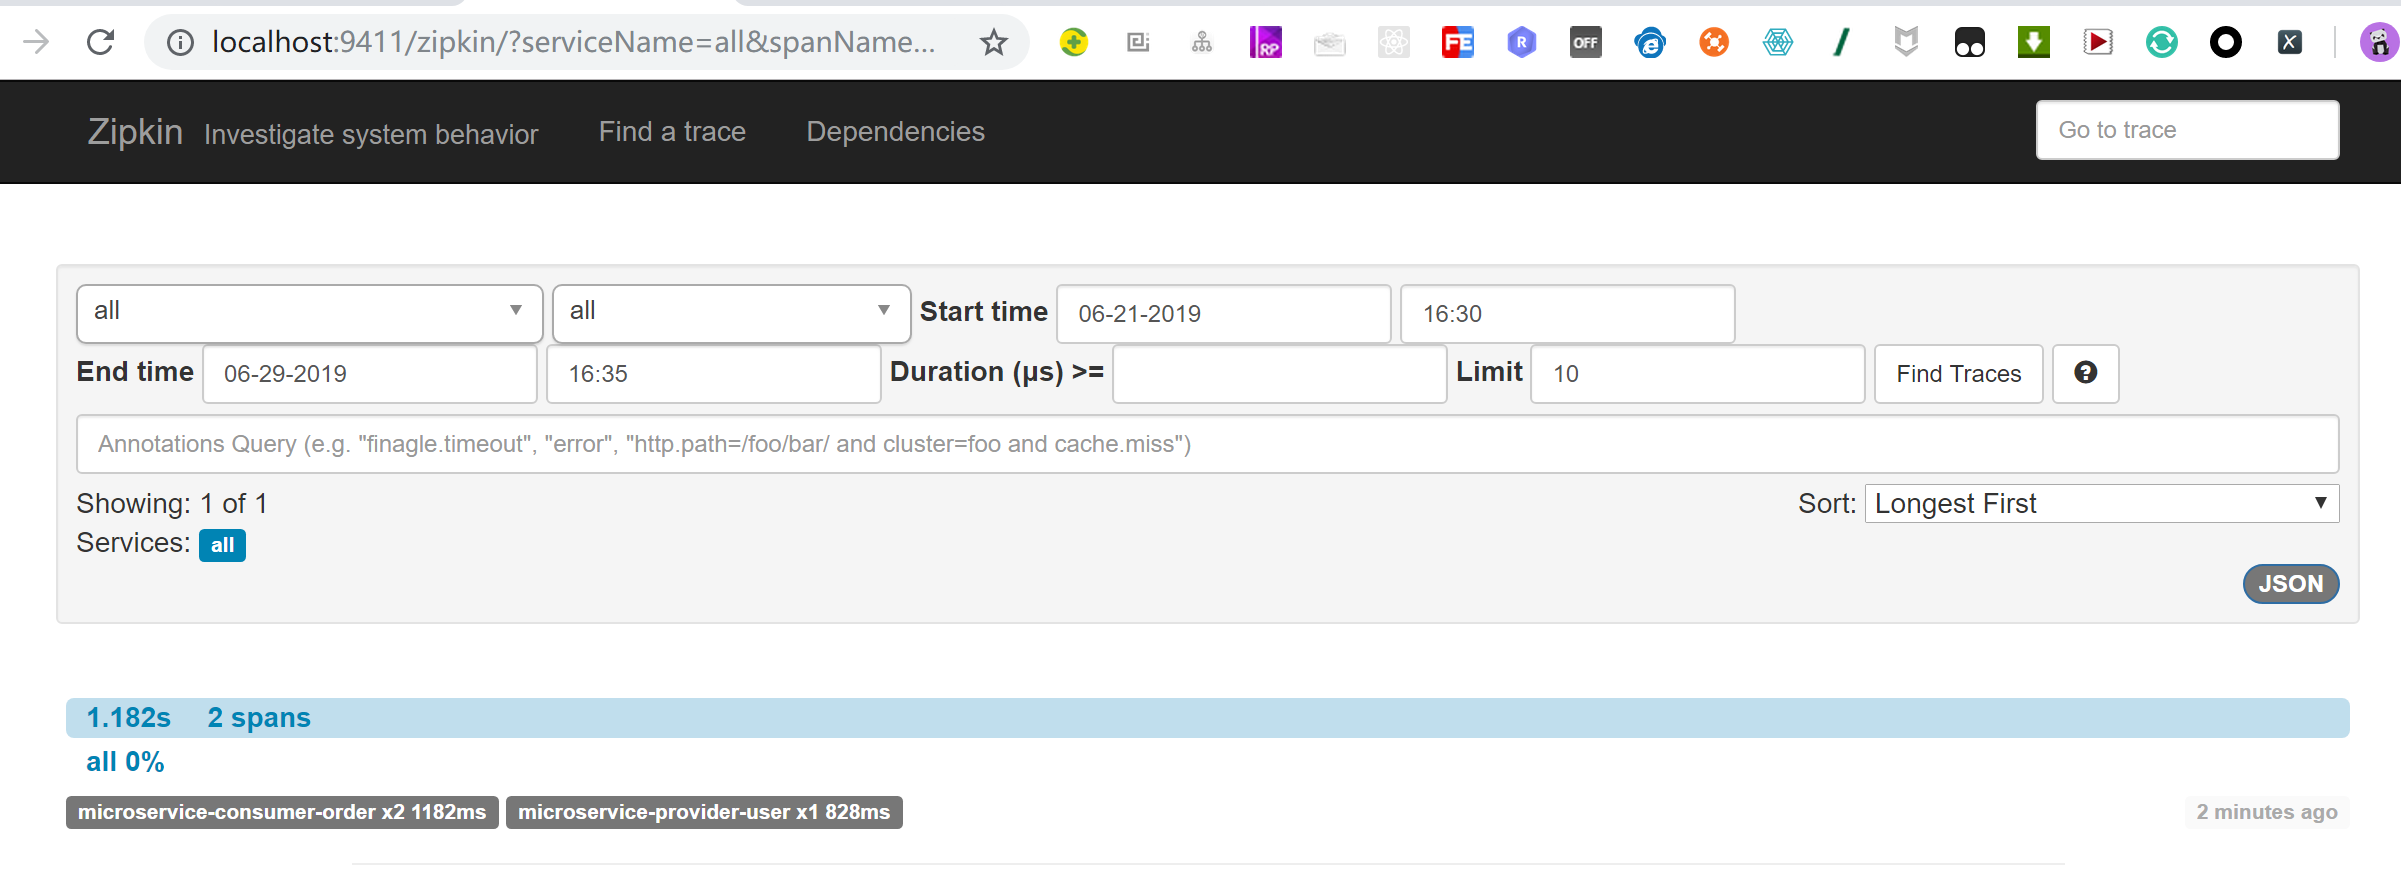
microservice-consumer-order 1.182秒 microservice-provider-user 0.8秒
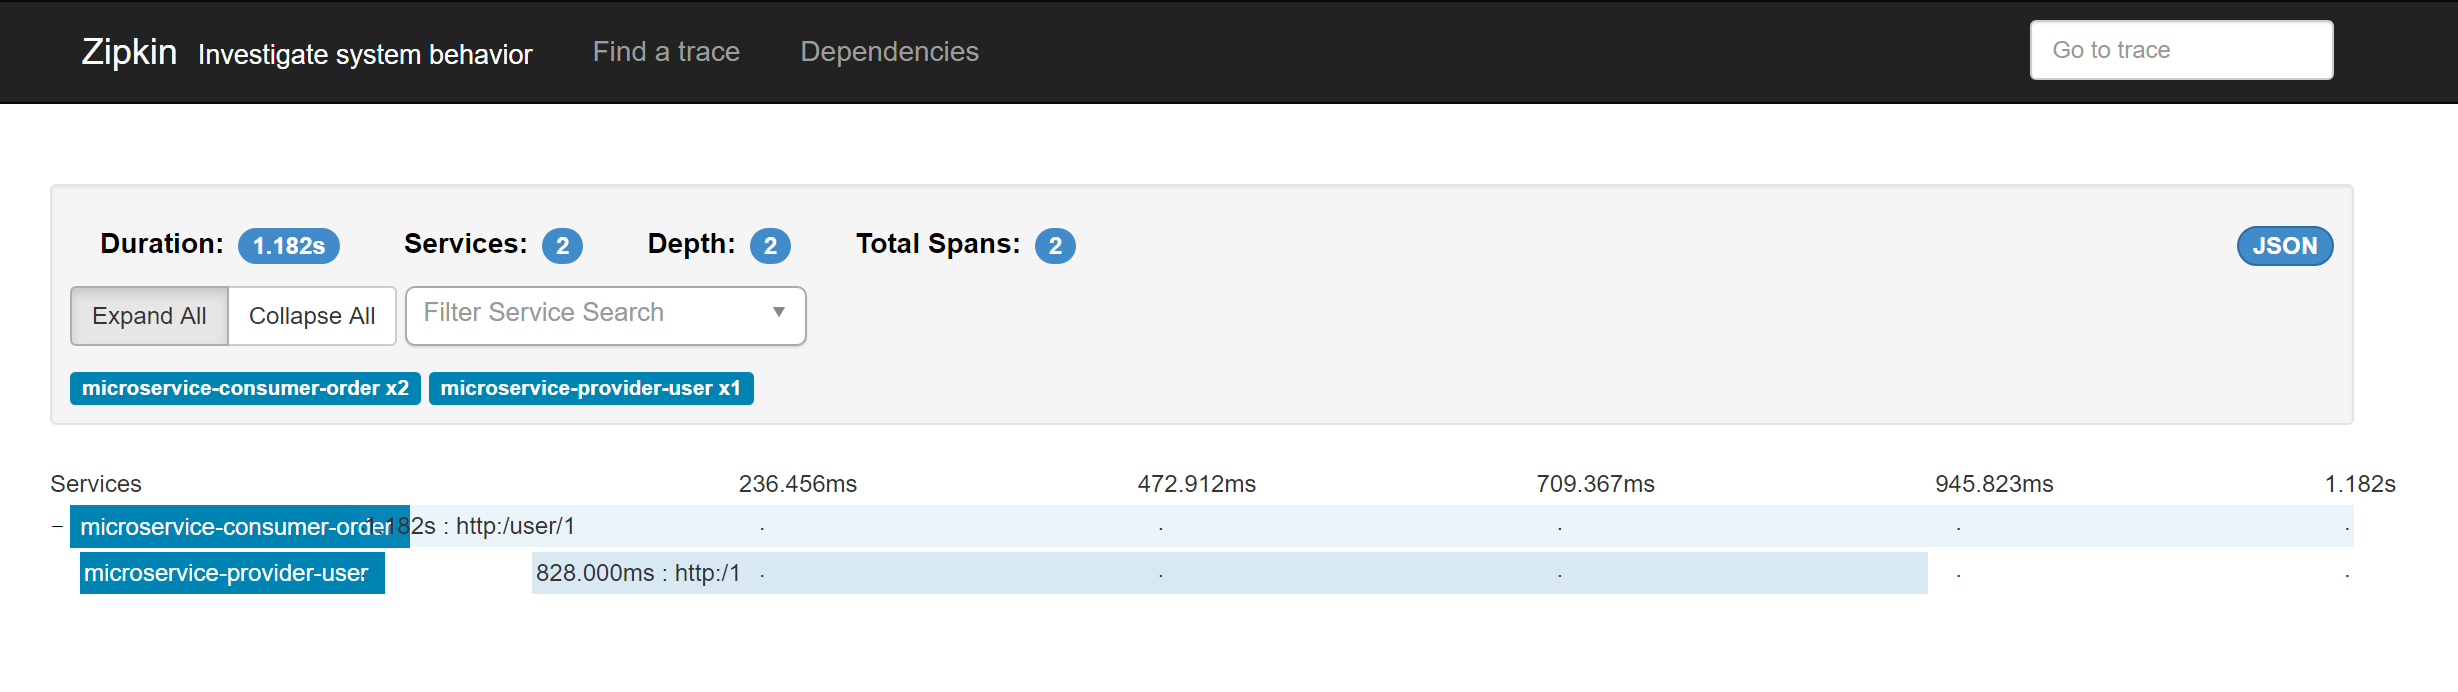
如果现在将11-ms-trace-zipkin-server重启服务后,发现日志不见了,原来信息都保存在内存中,如果服务挂了怎么办,需要把这些信息保存在一个数据库或者文件中,方便之后看。
Elasticsearch存储Zipkin的数据(六)
ElasticSearch是一个基于Lucene的搜索服务器。它提供了一个分布式多用户能力的全文搜索引擎,基于RESTful web接口。Elasticsearch是用Java开发的,并作为Apache许可条款下的开放源码发布,是当前流行的企业级搜索引擎。设计用于云计算中,能够达到实时搜索,稳定,可靠,快速,安装使用方便。官方客户端在Java、.NET(C#)、PHP、Python、Apache Groovy、Ruby和许多其他语言中都是可用的。根据DB-Engines的排名显示,Elasticsearch是最受欢迎的企业搜索引擎,其次是Apache Solr,也是基于Lucene。
注意:Elasticsearch 需要 Java 8 环境,在安装Elasticsearch之前先安装好JDK。
- ① Elasticsearch
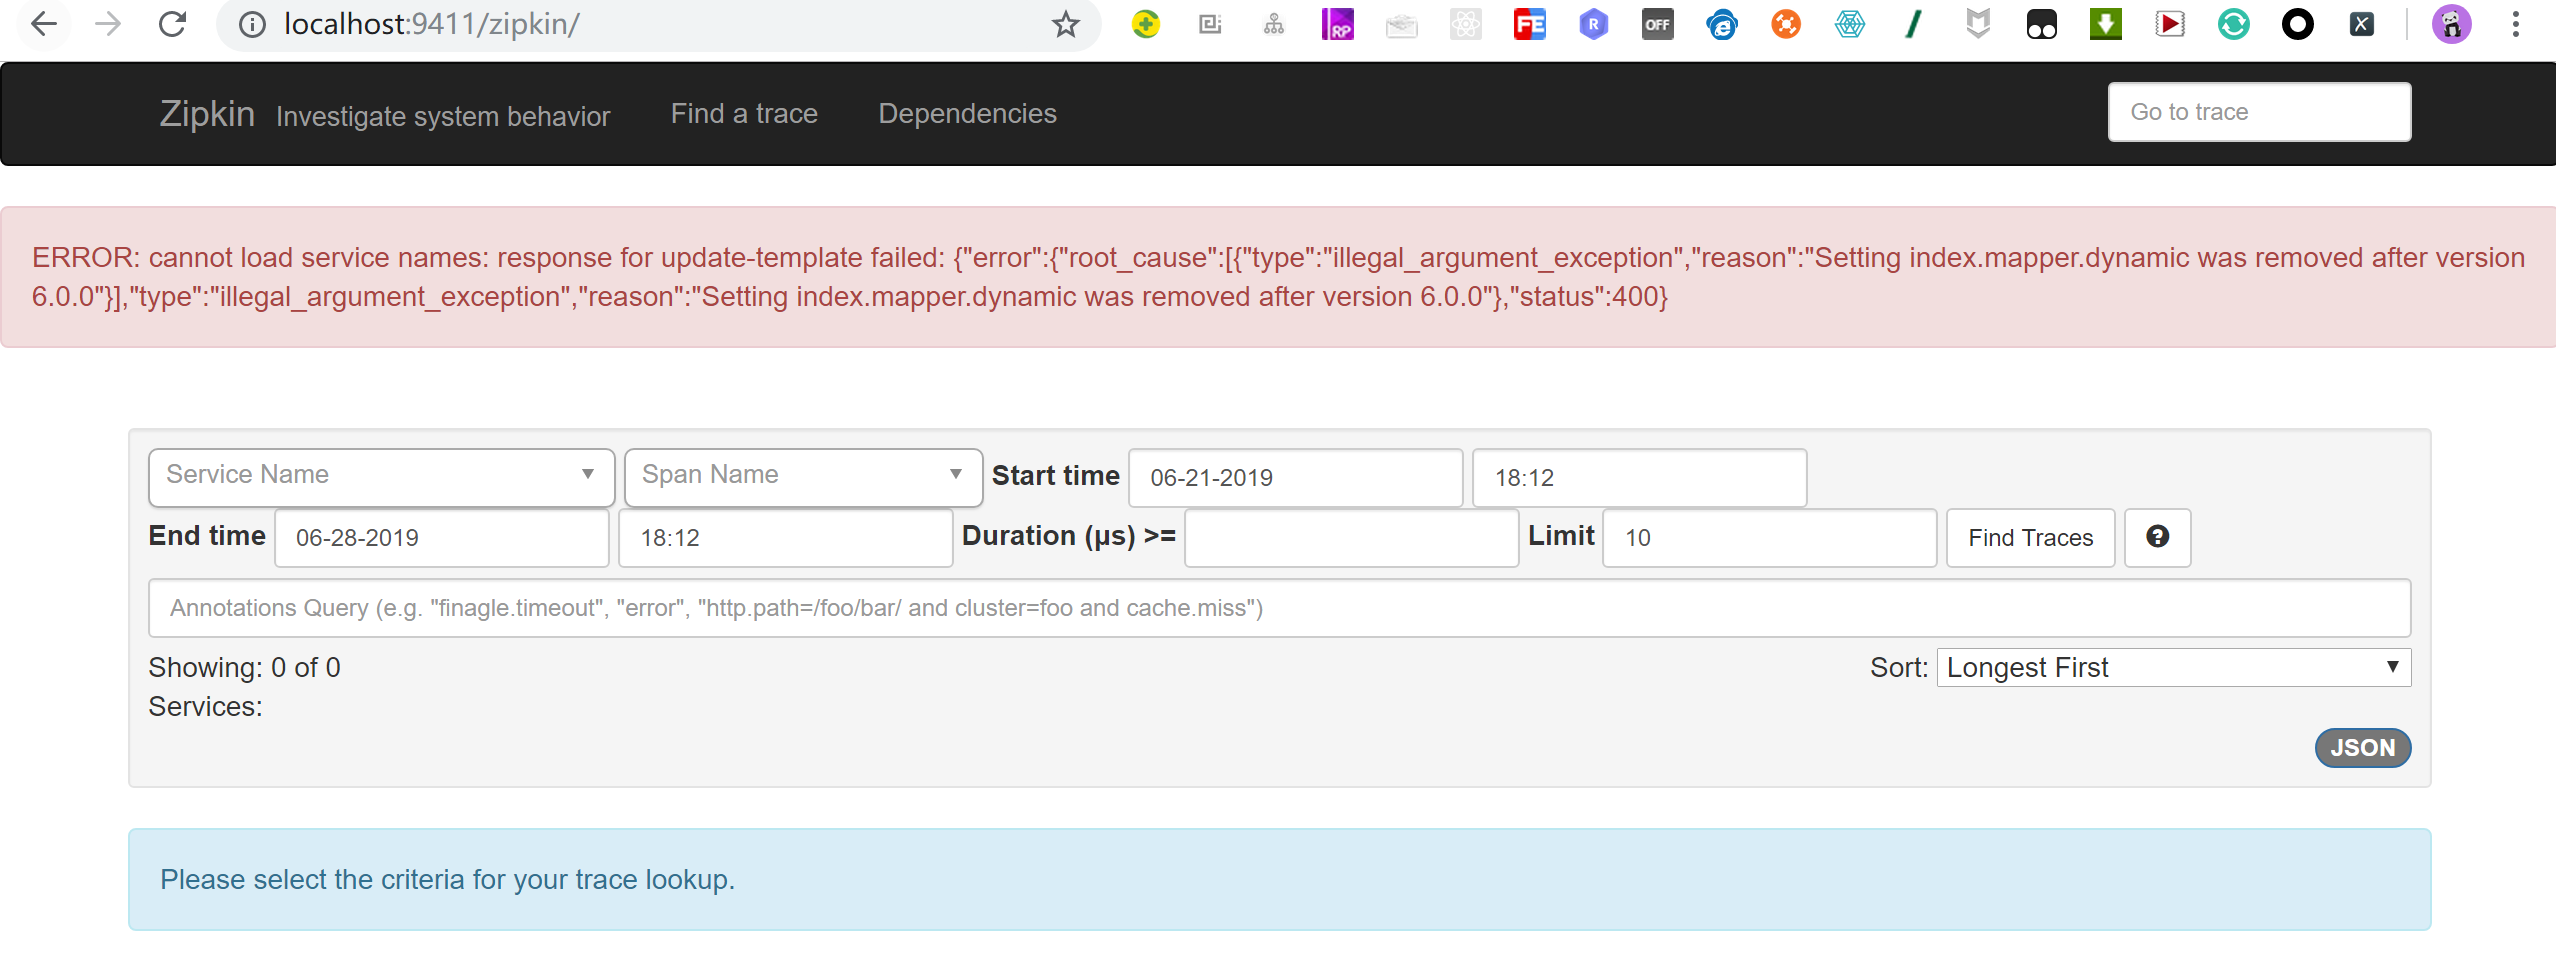
千万不要安装最新版本,因为你的springcloud版本低,这是我之前安装7.2的时候报错了。就用5.6.8版本的Elasticsearch
ERROR: cannot load service names: response for update-template failed: {"error":{"root_cause":[{"type":"illegal_argument_exception","reason":"Setting index.mapper.dynamic was removed after version 6.0.0"}],"type":"illegal_argument_exception","reason":"Setting index.mapper.dynamic was removed after version 6.0.0"},"status":400}

- ② windows安装
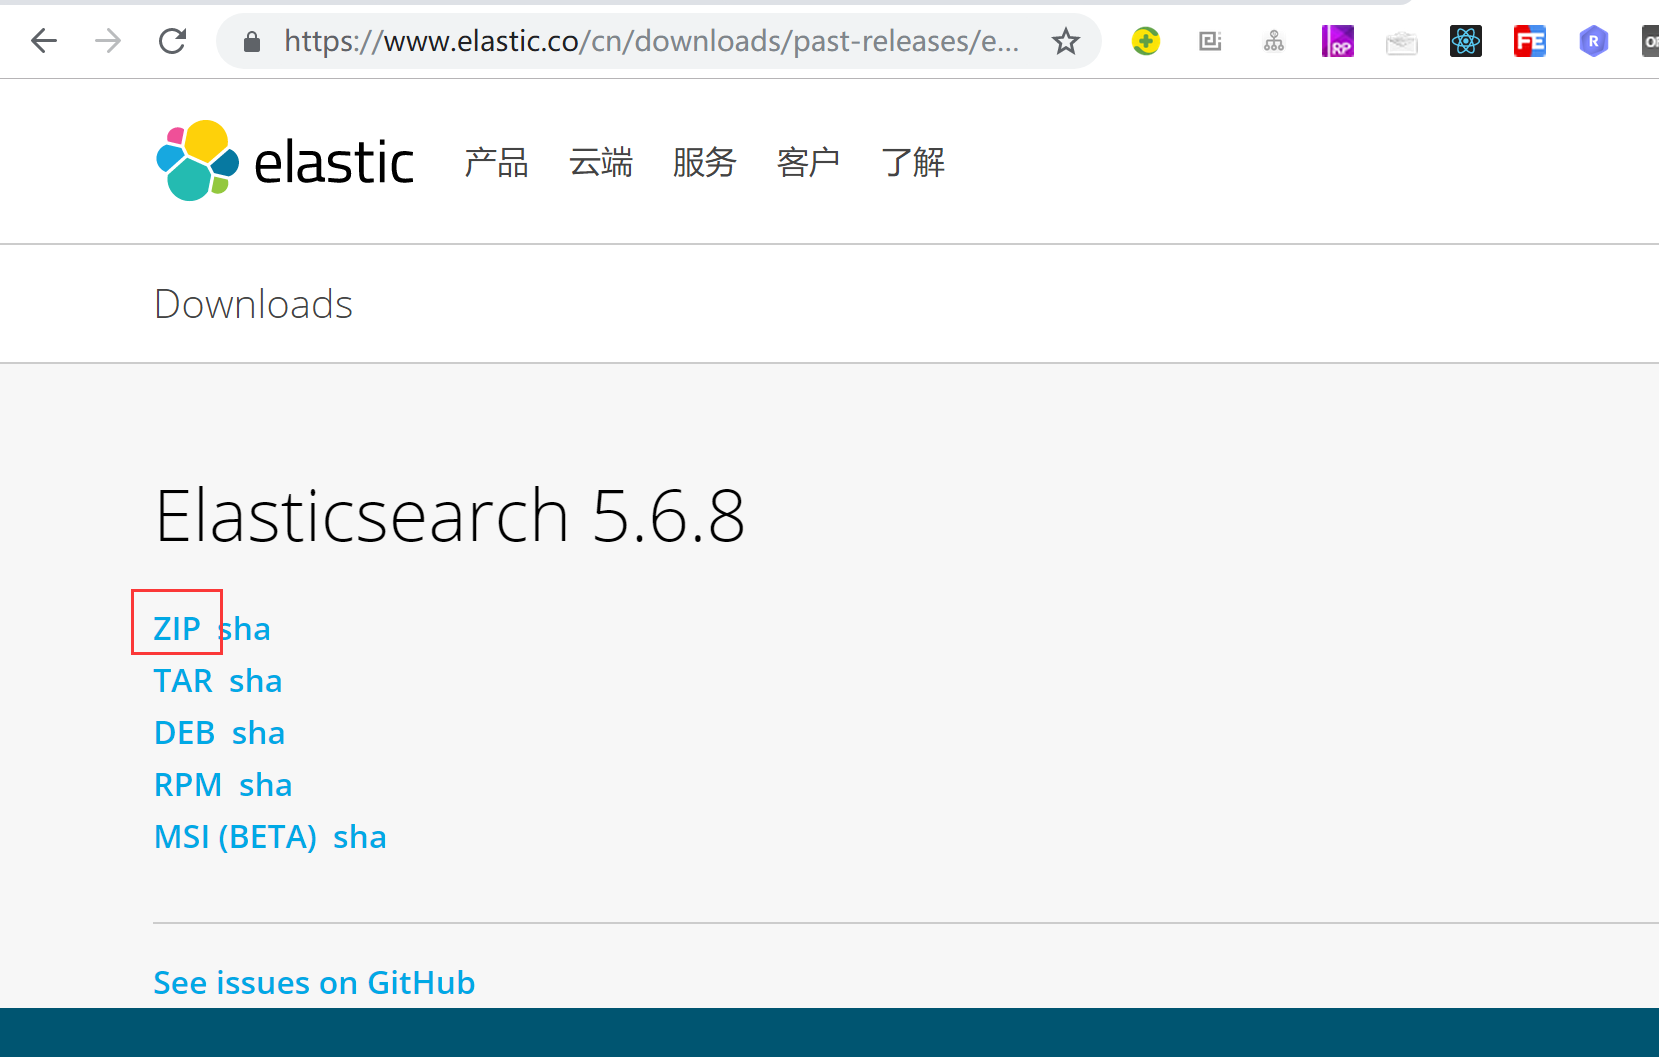
- 下载

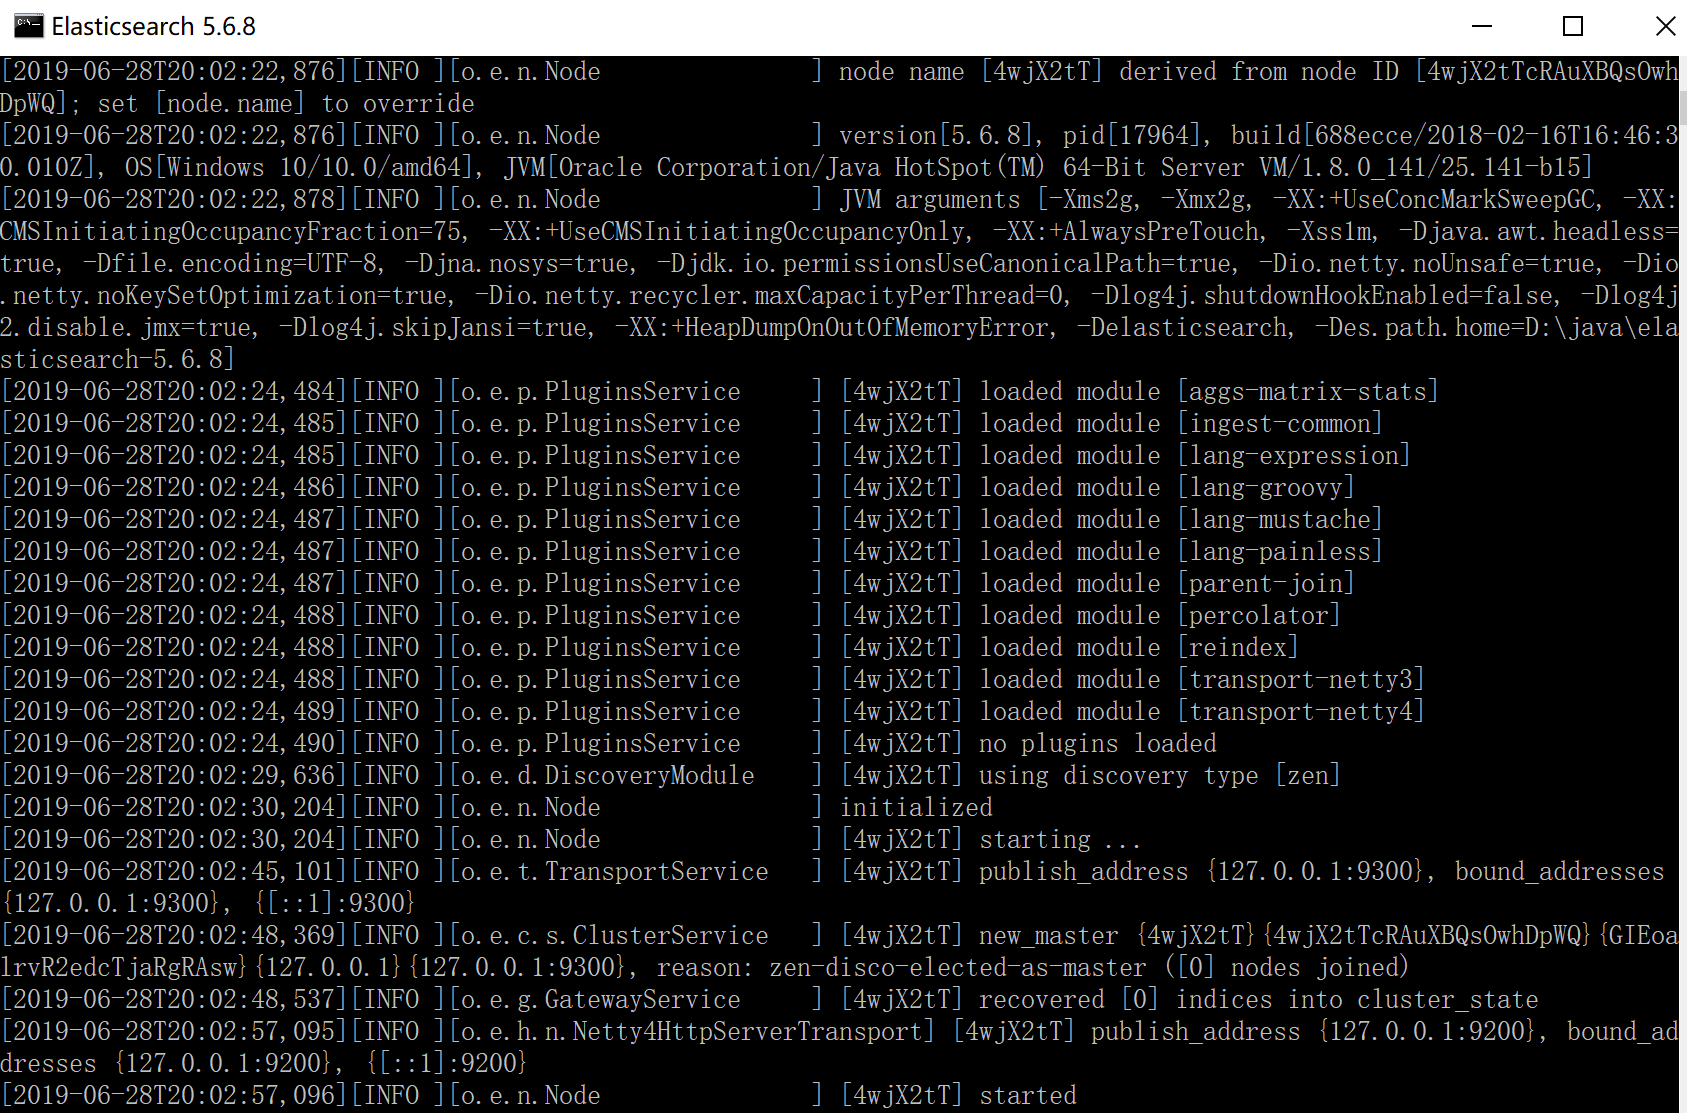
- 启动
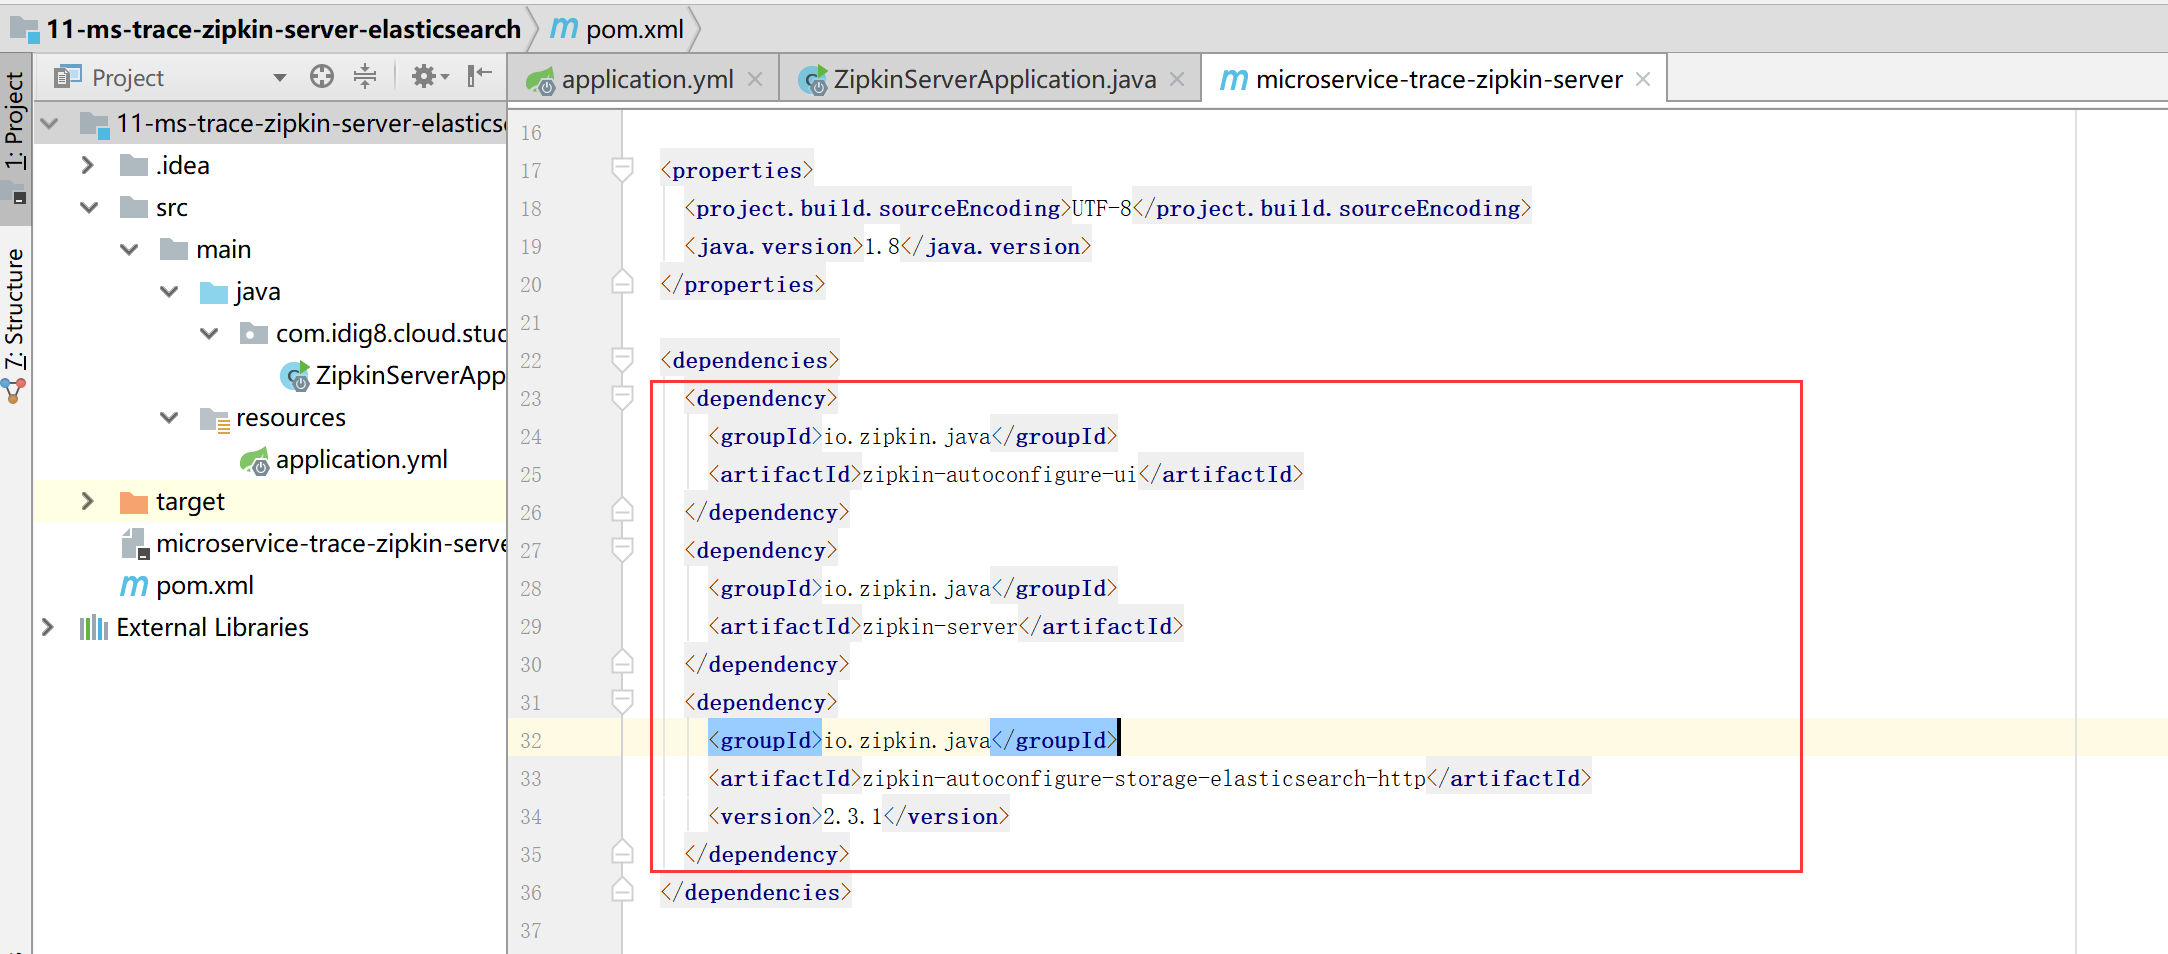
源码: 11-ms-trace-zipkin-server-elasticsearch
添加依赖
<dependency>
      <groupId>io.zipkin.java</groupId>
      <artifactId>zipkin-autoconfigure-ui</artifactId>
    </dependency>
    <dependency>
      <groupId>io.zipkin.java</groupId>
      <artifactId>zipkin-server</artifactId>
    </dependency>
    <dependency>
      <groupId>io.zipkin.java</groupId>
      <artifactId>zipkin-autoconfigure-storage-elasticsearch-http</artifactId>
      <version>2.3.1</version>
    </dependency>
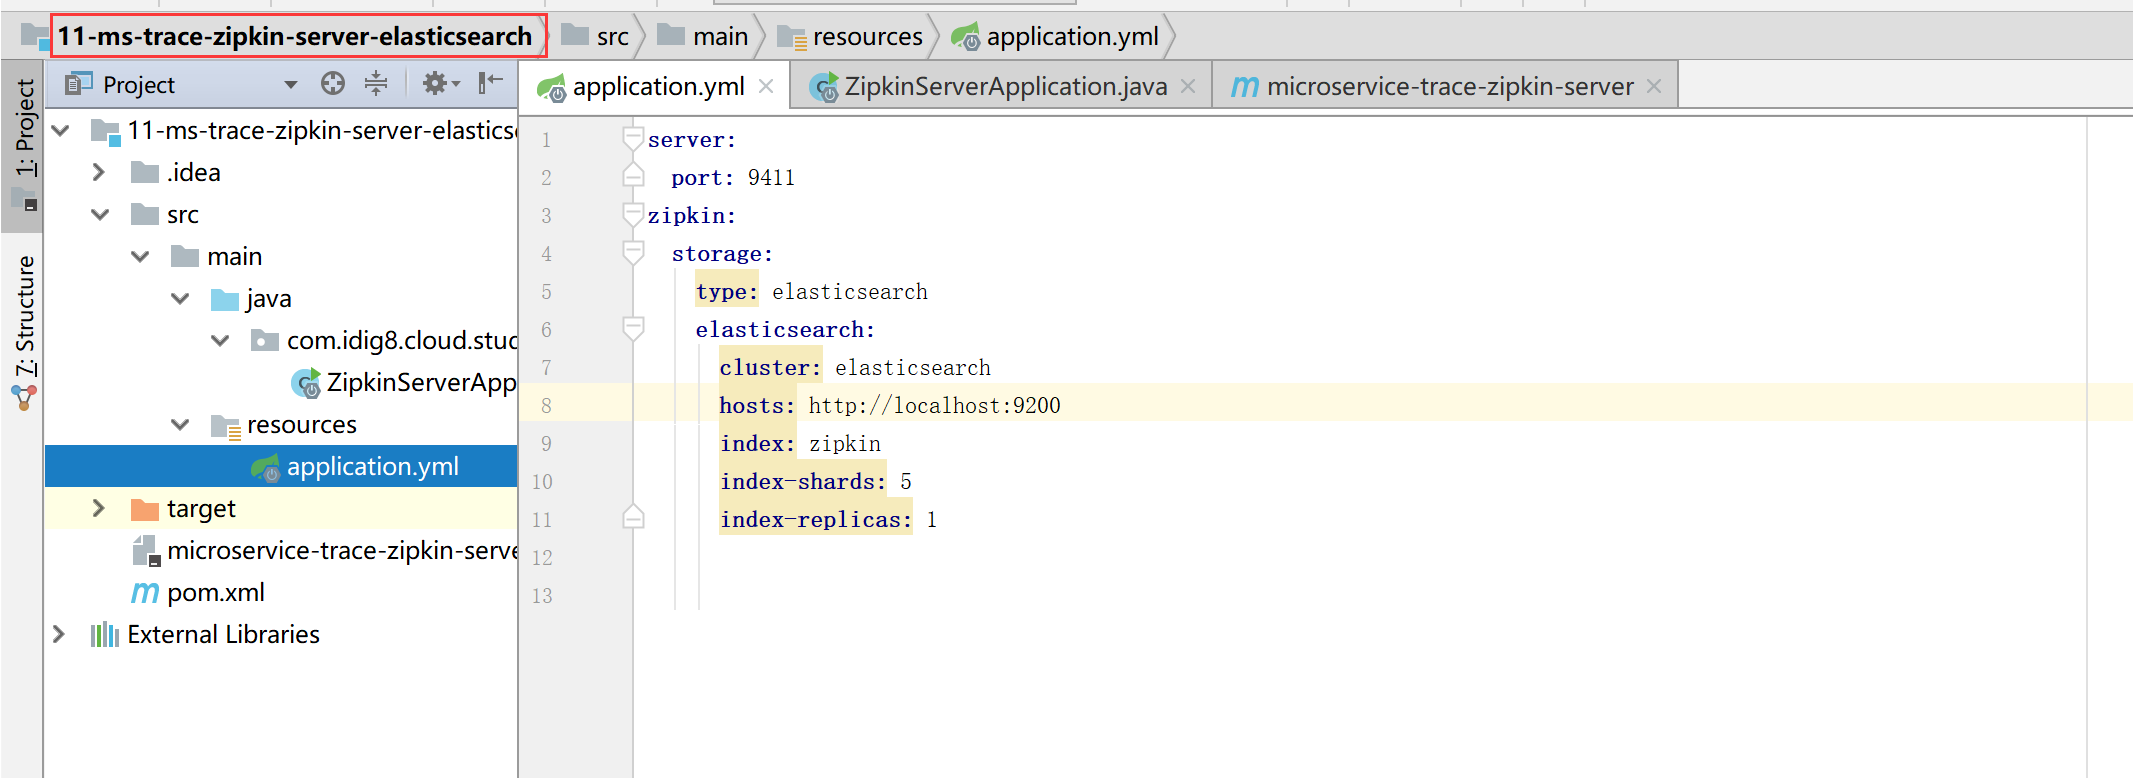
配置文件application.yml里增加elasticsearch连接配置
- ③ 访问如下地址
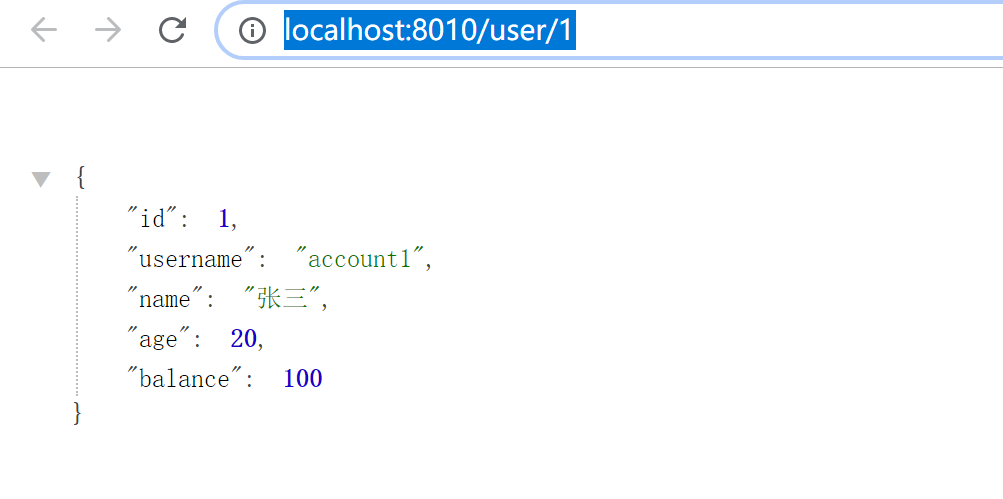
order访问:http://localhost:8010/user/1
zipkinWeb页面:http://localhost:9411/zipkin/
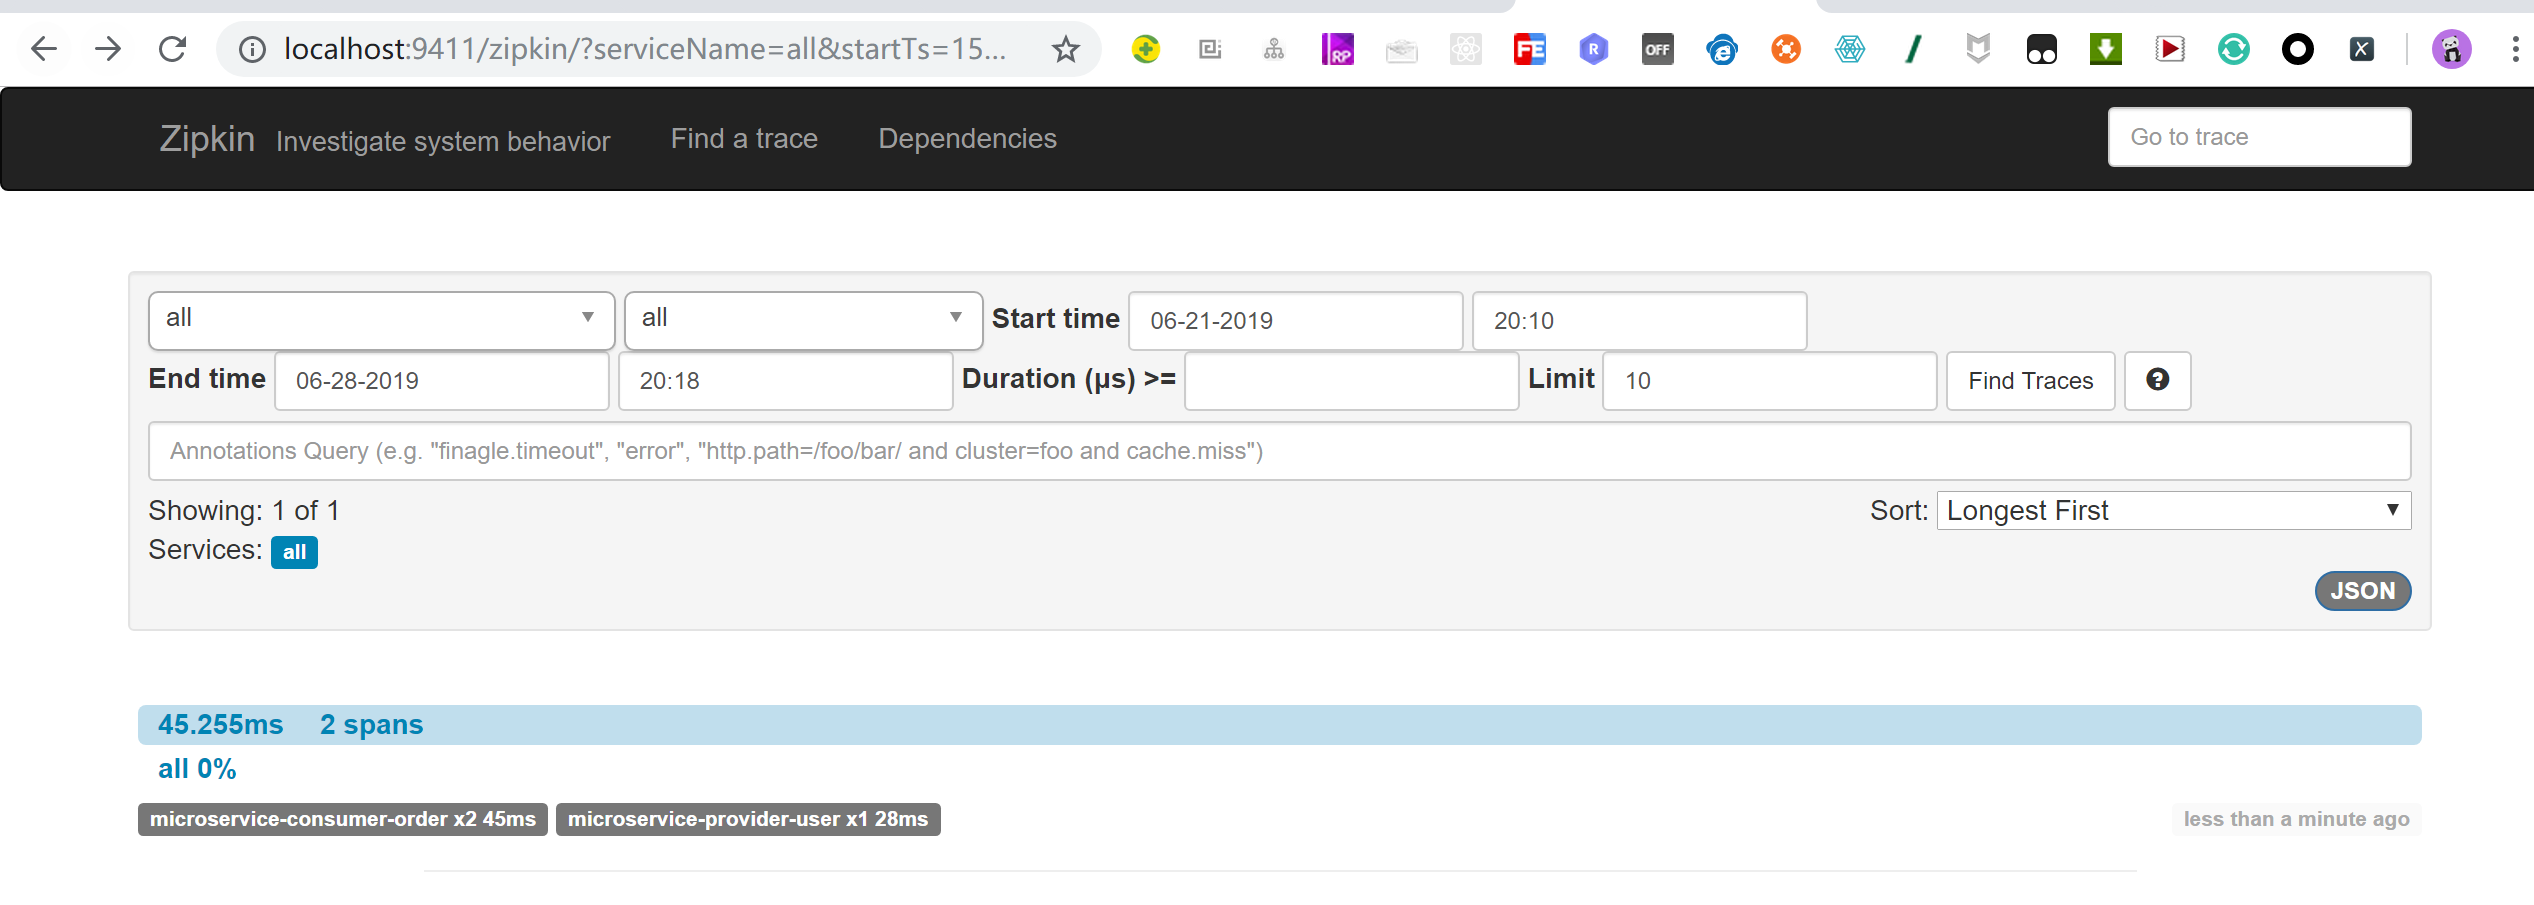
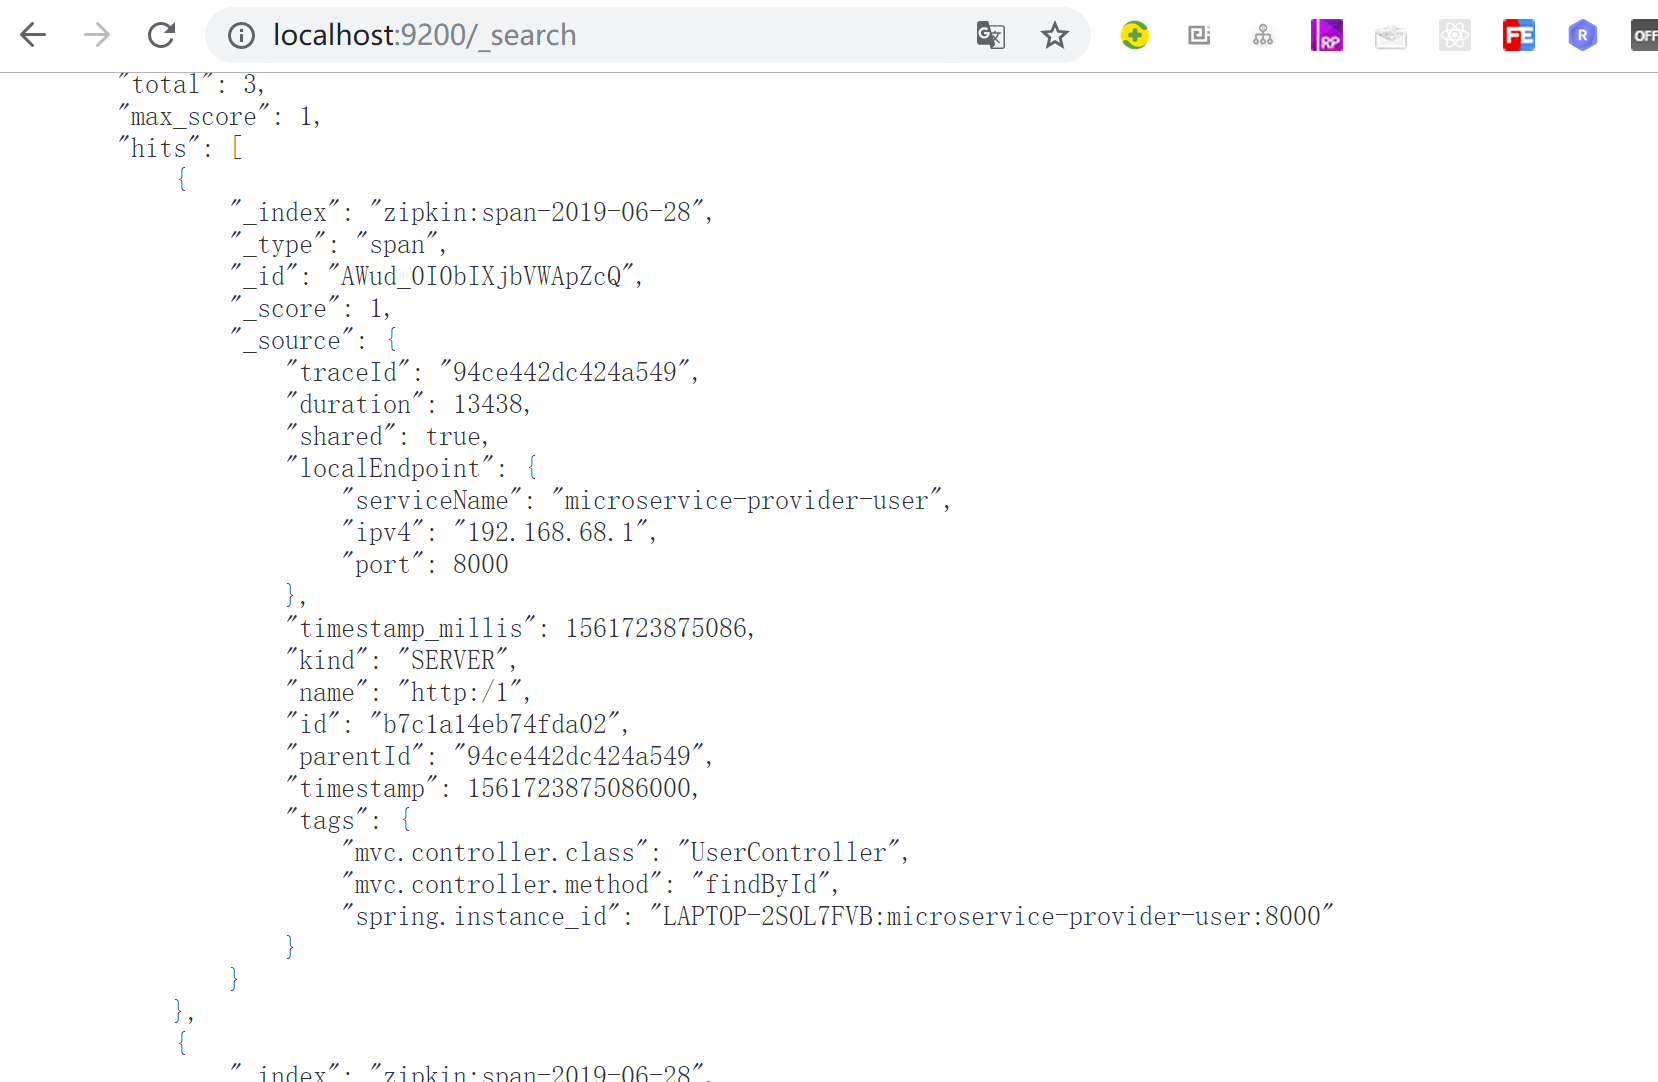
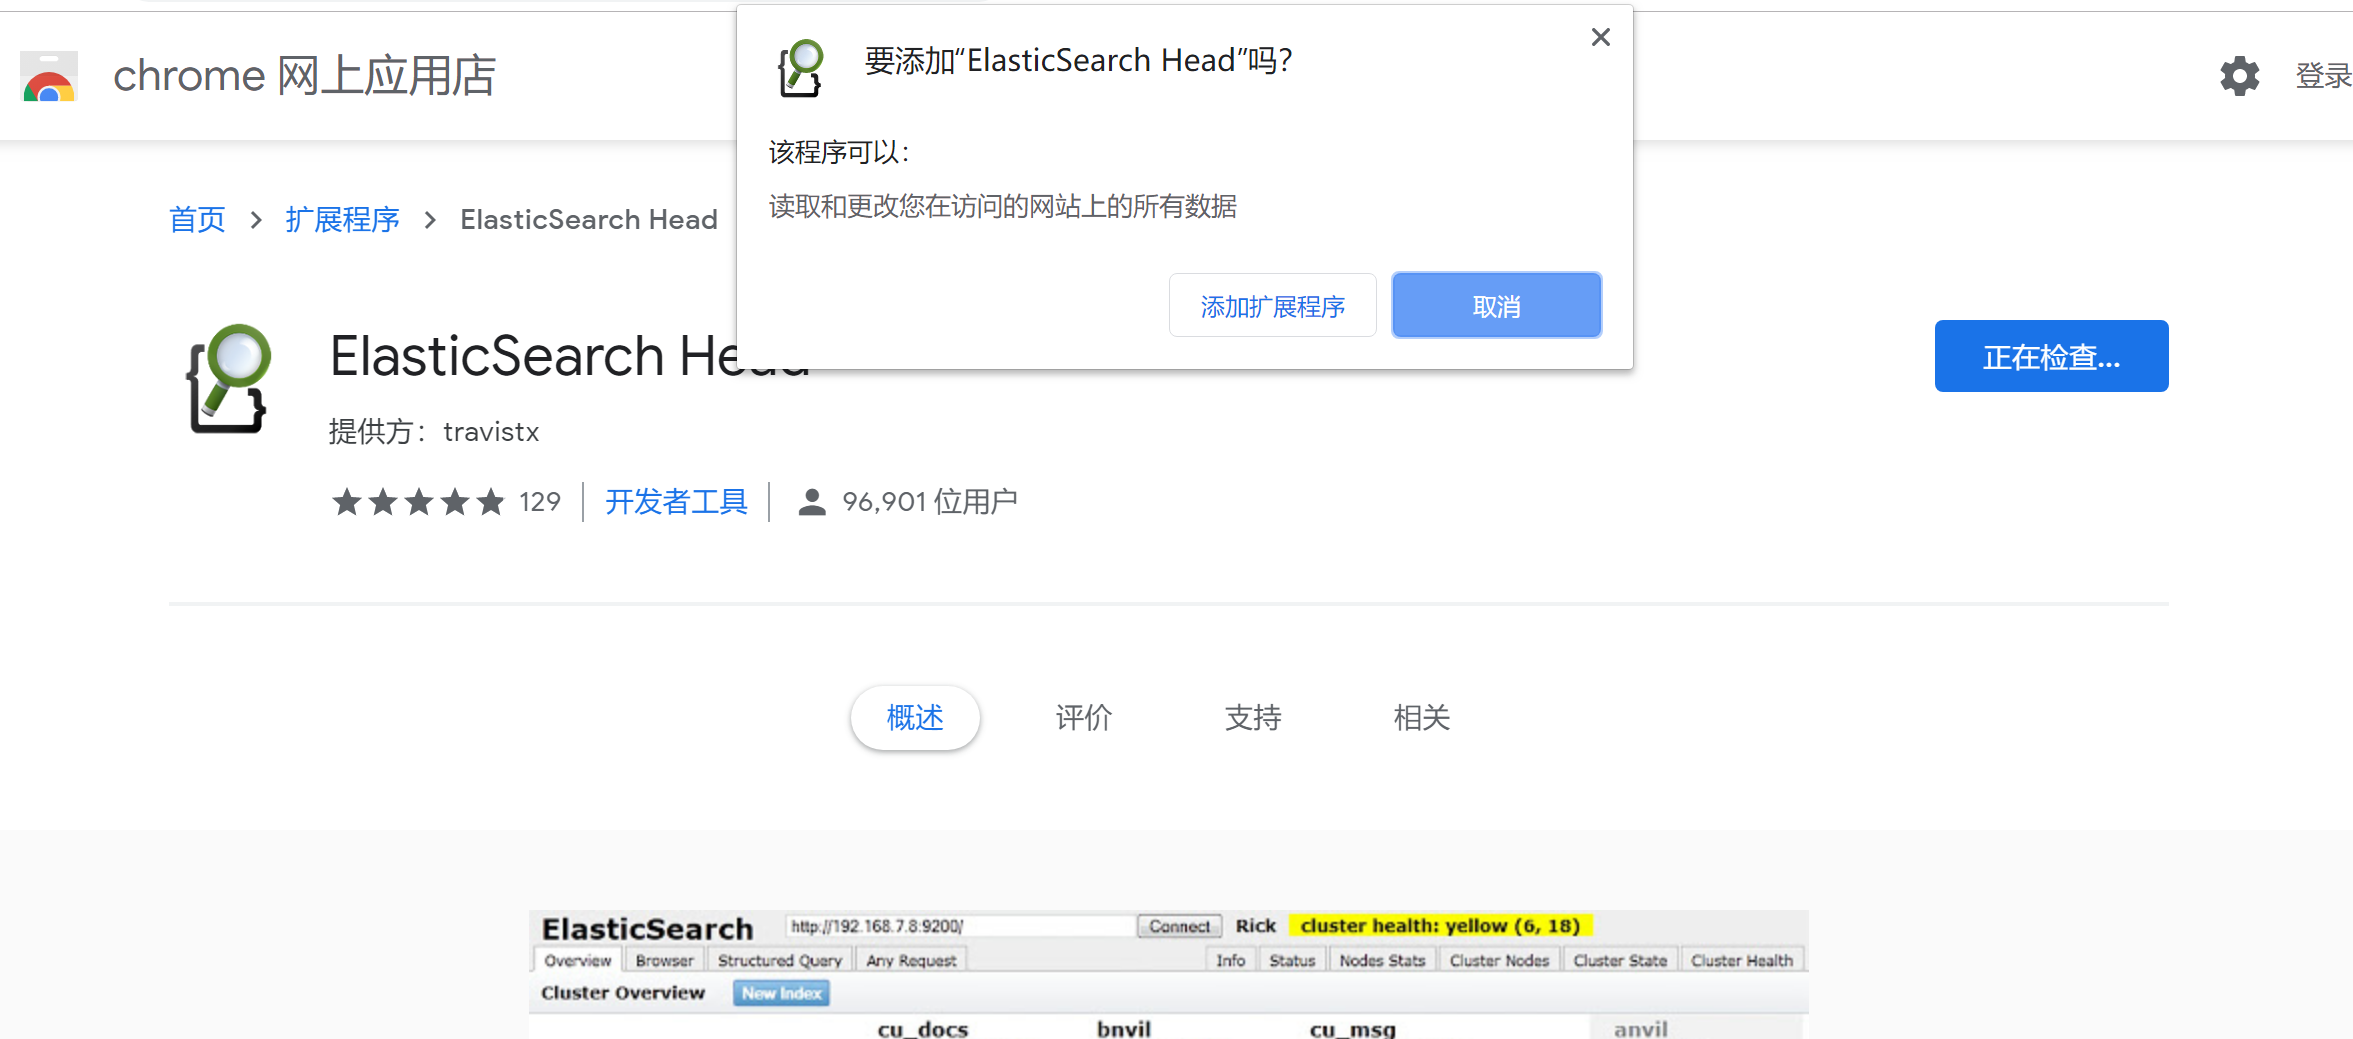
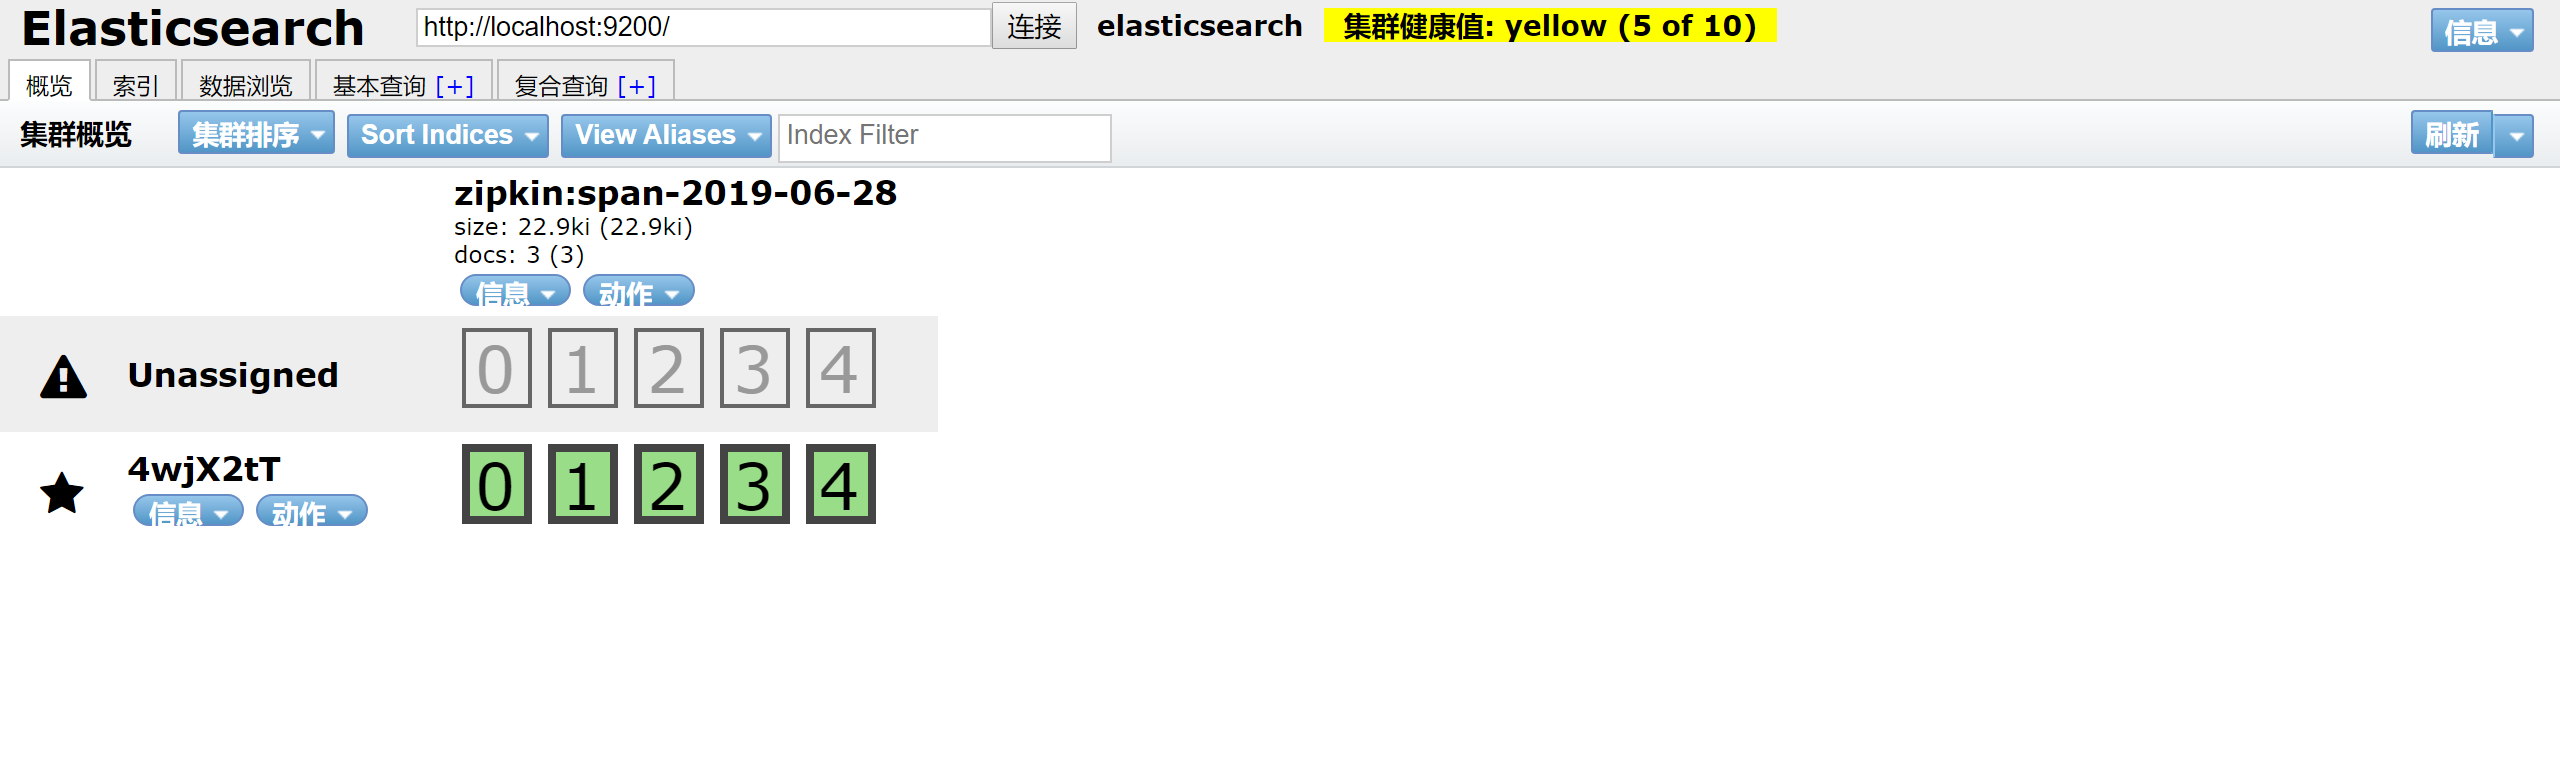
可视化:https://chrome.google.com/webstore/detail/elasticsearch-head/ffmkiejjmecolpfloofpjologoblkegm/related google插件的安装需要科学上网。
PS:5年前就见过别人演示这种系统,当时才开始搞分布式系统,现在想想确实没有你想不到的功能,只有你做不到的,分布式链路跟踪确实是开发和运维的神奇,良好的定位问题,线上问题的发现。